-
- Market Research
- |
- CBD Near Me
- |
- Giveaways
- |
- Newsletter
- |
- Contact
- |
- Advertise
- |
We are proud to publish The CBD Insider 2021 US CBD Consumer Report, the only statistically significant report solely about US CBD consumers.
The goal of our report is to explore the awareness, exposure, knowledge, and use of CBD by Americans, segmented by their current consumer status as it relates to CBD.
To help us do that, we drastically increased our sample size from just over 1,000 people in our previous report to 3,519 consumers who are demographically representative of the US census.
Click Here to Download The CBD Insider 2021 US CBD Consumer Report
Download all graphs, charts, and tables to use on your website here.
These respondents fell into one of four categories:
- Current consumer
- Past consumer
- Potential consumer
- Uninterested consumer
We found the approximate numbers of Americans who have used CBD, what they use it for, how much they use it, and how many have decided to replace a medication.
We also found the answers to pressing questions, such as:
- How are Americans using CBD?
- What prevents consumers from trying CBD?
- Why have some stopped using it?
- What can be done to help educate consumers and ease concerns?
All of this and much more can be found in the 111 pages of our 2021 Consumer Report.
You can dig through the details or get an overview of our most important findings in the Key Takeaways.
We sincerely hope you find the data in this report valuable, interesting, and actionable.
The CBD Insider 2021 US CBD Consumer Report
Executive Summary
American consumers from all demographics have made it clear that they are interested in cannabidiol (CBD) and optimistic about its potential, but the knowledge gaps that were revealed in our previous report have largely persisted. Large swaths of respondents are still unaware of how CBD works, how hemp extracts differ, and how much they should take.
Unlike last year’s data, the majority of current CBD consumers indicated that they have been using their products for more than a year. The onset of the COVID-19 pandemic in early 2020 proved to be a highly influential variable when it came to the manner in which respondents learned about and accessed CBD (online sales and advertising surging past brick and mortar).
As marketers, researchers, and third-party information sources continue to circulate claims regarding CBD’s effectiveness with no regulation from the FDA, consumer groups and demographics are pooling themselves into several different camps as it concerns their opinions and beliefs surrounding CBD.
Several trends in the data point to the influence of age, gender, and other demographics on the willingness to try certain product types (e.g., older respondents are less likely to try CBD vape), the factors affecting purchasing decisions, perceptions about where and if CBD brands should be allowed to advertise, and much more.
Current consumers and even non-consumers are calling for the FDA to step in and regulate CBD for reasons of safety, raising industry standards of quality, and ensuring that each product is worth the cost.
A few themes kept repeating themselves in the data—themes that bear great influence over the perception and use of CBD, both now and in the future.
Here’s a brief summary of some of the most important points we found in the data:
- Just under a third of survey respondents (32.7%) has used CBD, and another 33% admitted they knew nothing about it.
- Widespread uncertainty about CBD’s safety, effectiveness, potency, and other important details continues to affect consumers’ willingness to try CBD products.
- As in the previous report, large numbers of current consumers are supplementing or replacing medications with CBD, a practice that is moderately correlated with age and gender.
- The COVID-19 pandemic has shifted consumer engagement with CBD ads and information to online channels, though marijuana dispensaries and brick-and-mortar sellers are still prominent.
- Edibles, gummies, and CBD oil tinctures continue too battle for the most widely used, recognized, and preferred CBD product type; tinctures were most used and recognized in 2021.
- Consumers are continuing to approach CBD more casually, that is, for relaxation and comfort rather than aches and discomfort, muscle soreness, and other purported applications.
Key Takeaways
Nearly One in Three Americans Have Tried CBD
Taking into account both current (18.2%) and past (14.5%) consumers, almost a third of all respondents (32.7%) were not only interested in CBD, but had used it personally as well.
This sizable chunk of the respondent pool was almost exactly equal in size to the portion of (would-be) respondents who were not at all familiar with CBD (33%).
As anecdotal and research evidence continues to pile up, we expect to see the number of current and former consumers eclipse the number of non-users, but the timing of FDA regulation—if it ever occurs—may drastically affect how many consumers keep their hopes up and how many transition to similar alternatives.
Alternative CBD Product Types Are Gaining Ground
on Oil
As usual, CBD oils/drops/tinctures were the most frequently used product type across all consumer groups, as well as the type that non-users would feel more comfortable trying.
However, gummies have been steadily catching up to
CBD oil, trailing by a smaller margin amongst current consumers who had tried both product types (53.9% gummies versus 55.3% CBD oil) than past consumers (39.3% gummies to 48.7% oil).
Considering the high level of uncertainty surrounding CBD dose accuracy, it’s little surprise that gummies containing pre-measured amounts of the compound have
continued to grow in popularity.
CBD vape has had a more polarizing increase in visibility, the approval of which lags behind these two frontrunners, dipping disproportionately in certain groups (with increasing age and education level, for example).
Nonetheless, CBD vape products have continued to increase in demand with the rest of the industry.
Age Greatly Affects CBD, Medication Prioritization
and More
Age was among the most influential factors affecting respondents’ opinions and practices surrounding a large majority of the CBD-related issues we presented.
One of the most salient trends we noticed was that older age groups were more likely to replace prescription opiates with CBD; among current consumers who said
they replaced a medication, the 55-64 group (52.4%) was significantly more likely to do so than all other groups, beating second place (45-54 group, 30.8%) by more than twenty percent.
Conversely, the second youngest group (25-34) was significantly more likely to replace prescription anti-anxiety drugs with CBD (68.6%) than all other groups
(second place: 35-44, 55%).
The same trends applied when respondents were asked about supplementing medications with CBD; supplementing anti-anxiety medications trended down with increasing age, and vice versa for supplementing prescription opiates.
As age increased, respondents (potential consumers) were also less likely to cite relaxation, energy, improved mood, improved focus, and skin improvements as reasons to try CBD, but “alternative to over-the-counter or prescription medication” trended up.
If explored on a larger scale, these findings could be instrumental to defining safe and effective CBD use parameters for consumers, regulators, and key access points
within the healthcare infrastructure.
Knowledge Gaps Drive Consumer Behavior and Beliefs In Multiple Directions
A number of widespread knowledge gaps in several key areas related to CBD’s legality, safety, effectiveness, and general characteristics prevented even current customers from weighing in on several of the survey questions.
More than half of the respondent pool was unsure of which extract type they would consider using, and more than three-quarters of all respondents couldn’t guess what a typical CBD serving size would be.
Similarly, almost three-quarters of all participants were unable to identify any online CBD informational resources.
Taking into account all the data from all four consumer groups, the largest and most consistent knowledge gaps we found were in the following areas:
- Knowledge of hemp extracts and the differences between them.
- CBD’s legality on a state and/or federal level.
- How much CBD they were consuming per dose (or how much they think all users should aim for).
- The differences between THC and CBD (many respondents believe CBD could elicit a “high”)
In the crosstab data, we found that the lack of dose size awareness was especially prevalent among Whites or Caucasians—41% were unsure of how many milligrams of CBD they took per serving, compared to 26.7% of Blacks or African Americans and 22.4% of Hispanic or Latino respondents.
Additionally, women were more likely to cite “not sure where to buy it” (24.1%) as a reason they had not tried CBD yet (13.6% of men answered the same).
As a result of this uncertainty, potential consumers appear to be holding off on trying CBD (36.3% of them said they were “not sure” if they’d try it in the near future) until they had more information.
Relaxation Trumps Pain for the Top Reason to Use CBD
Though CBD has been implicated by research as a potential anti-inflammatory and analgesic agent, respondents from all consumer status groups and (almost) all demographics seem to gravitate towards the stress-reducing benefits of the compound.
The gap isn’t massive, but it’s noticeable; 60.3% of current users said they use CBD for relaxation and stress relief, compared to 53.6% who use it for aches and pains.
Preference for using CBD to relax is significantly more noticeable among women who haven’t tried CBD yet; 55.2% of them listed relaxation as a reason they would try CBD versus 40.2% of men.
We suspect this more casual approach to CBD (with the exception of older age groups) is a product of lackluster legislation and regulation.
Consumers Still Want the FDA to Step In
Finally, CBD consumers of all types are still hoping for FDA approval and regulation of CBD (34.8%), or a mix of FDA oversight and industry self-regulation (29.7%).
This wave of support has ebbed somewhat significantly when compared to the 2019 data (73.9% supported FDA or mixed regulation last year vs 64.5% in 2021), perhaps because the momentum of 2018’s Farm Bill riled up interest that faded as more solidly defined legislation was delayed into 2020 and beyond.
Broken down by status, uninterested consumers were more supportive of FDA regulation (46.4%) than all other groups, implying that the lack of regulation is highly involved in their lack of interest.
Consumers and CBD brands alike will be able to clearly delineate safe and effective uses for CBD with FDA regulation, which will likely cause a spike in interest and consumption.
Price Is Still a Deciding Factor
Both former and potential CBD consumers have voiced consistently throughout the survey that price is a major reason they aren’t currently using CBD products.
Specifically, more than half of all potential users (50.3%) and a greater number of former users (55.1%) stated that the price per serving was very important to their purchasing decision.
Furthermore, over one in five potential consumers (21.3%) stated outright that they hadn’t used CBD yet because it was too expensive, while nearly one in three past consumers (32.4%) stopped using CBD because it was too expensive.
In other words, price alone can deter someone from following through with a purchase, whether that person has prior experience with CBD or not.
About the CBD Insider
The CBD Insider is an independent publication specializing in news, analysis, and market research for the CBD Industry.
Our mission is to bring honest, understandable, and authoritative information about CBD products, companies, brands, and industry groups to consumers. The publication was founded in 2018 by Ian Eckstein with the purpose of helping consumers make educated choices when purchasing CBD, highlighting CBD companies who are building their brands in a responsible manner, and providing actionable marketing insights for the CBD industry.
Methodology
Using a marketplace with a direct connection to the most trusted sample providers, we asked a demographically representative sample of people from the United States about their attitudes and practices surrounding CBD.
Participants took a roughly 15-minute survey and responses were collected from January 14, 2021 through February 1, 2021.
We surveyed a total of 5,251 respondents, but 1,732 were filtered out because they were “not at all familiar” with CBD, leaving us with 3,519 eligible participants.
Similar to last year’s report, the respondents were segmented into groups based on their consumer status:
- Current consumers: Respondents who are currently using CBD.
- Past consumers: Respondents who have used CBD, but no longer do so.
- Potential consumers: Respondents who aren’t currently using CBD, but would consider using it in the future.
- Uninterested consumers: Respondents who are aware of CBD, but have no intention of using it.
Results were also analyzed by key demographic groups, including:
- Age
- Gender
- Race
- Region
- Education Level
- Income Level
- Military/Veteran Status
- Disability Status
Demographics
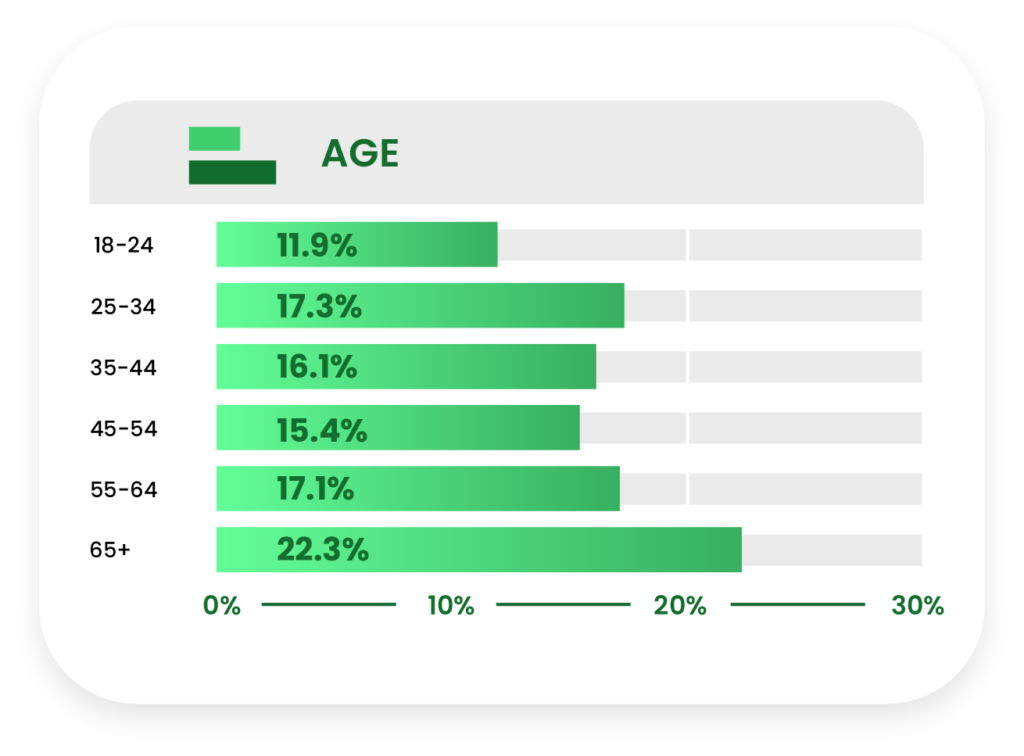
Over half (54.8%) of our respondents are 45 years of age or older.
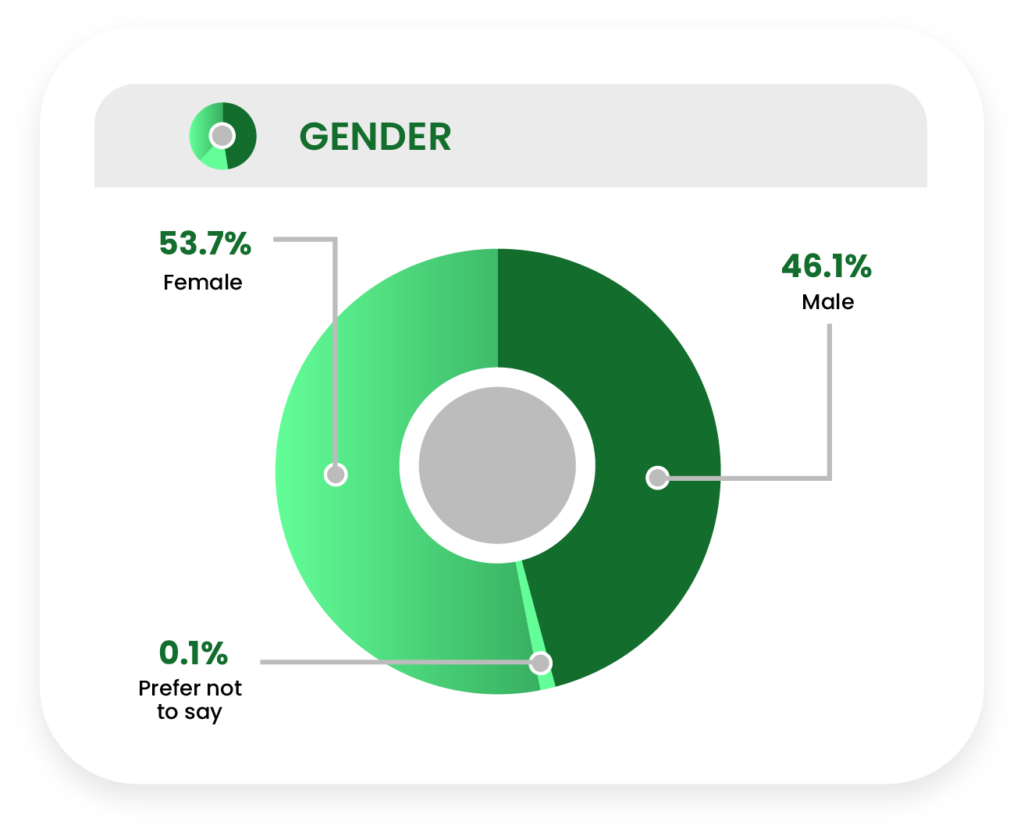
Nearly three-fourths of respondents (73.3%) said they were White or Caucasian, while just over one in five (22.6%) identified as Black or African American, Hispanic or Latino, or Asian or Asian American. About 15% of all respondents indicated they were of Hispanic origin, many of which also identified as White or Caucasian.
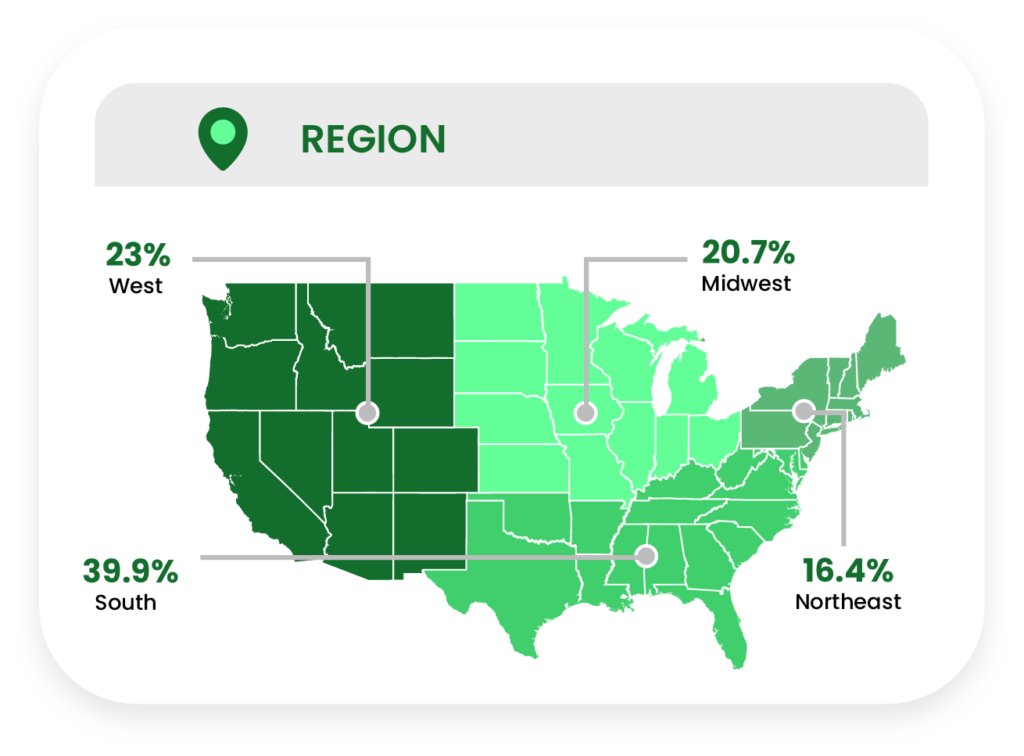
We separated respondents into the four regions recognized by the United States Census Bureau: 23% are from the West, 39.9% are from the South, 20.7% are from the Midwest, and 16.4% are from the Northeast.
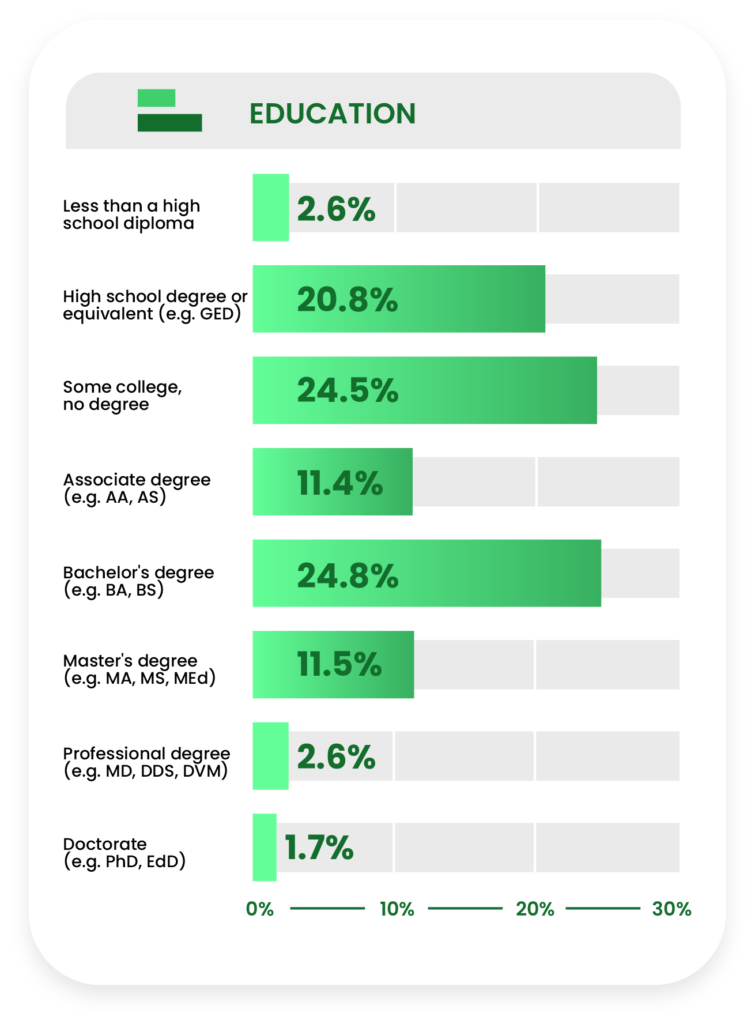
About half of respondents reported having no college degree (47.9%).
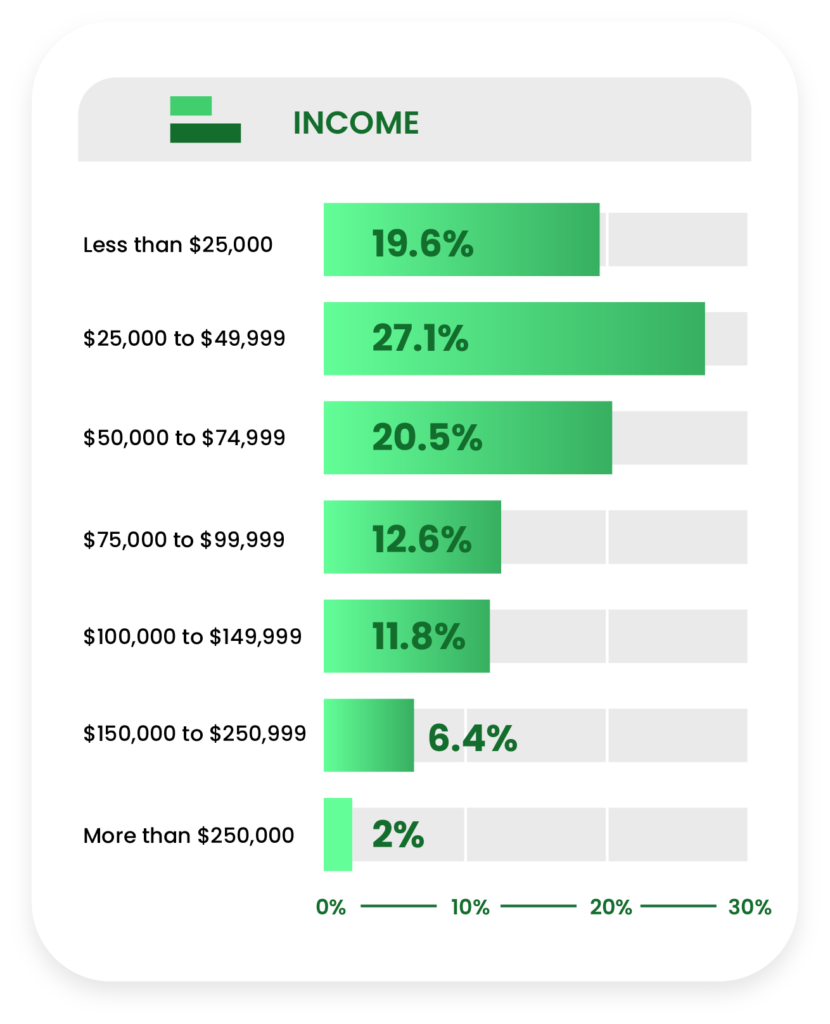
When asked about household income, about two-thirds of respondents (67.2%) said they make less than $75,000 annually.
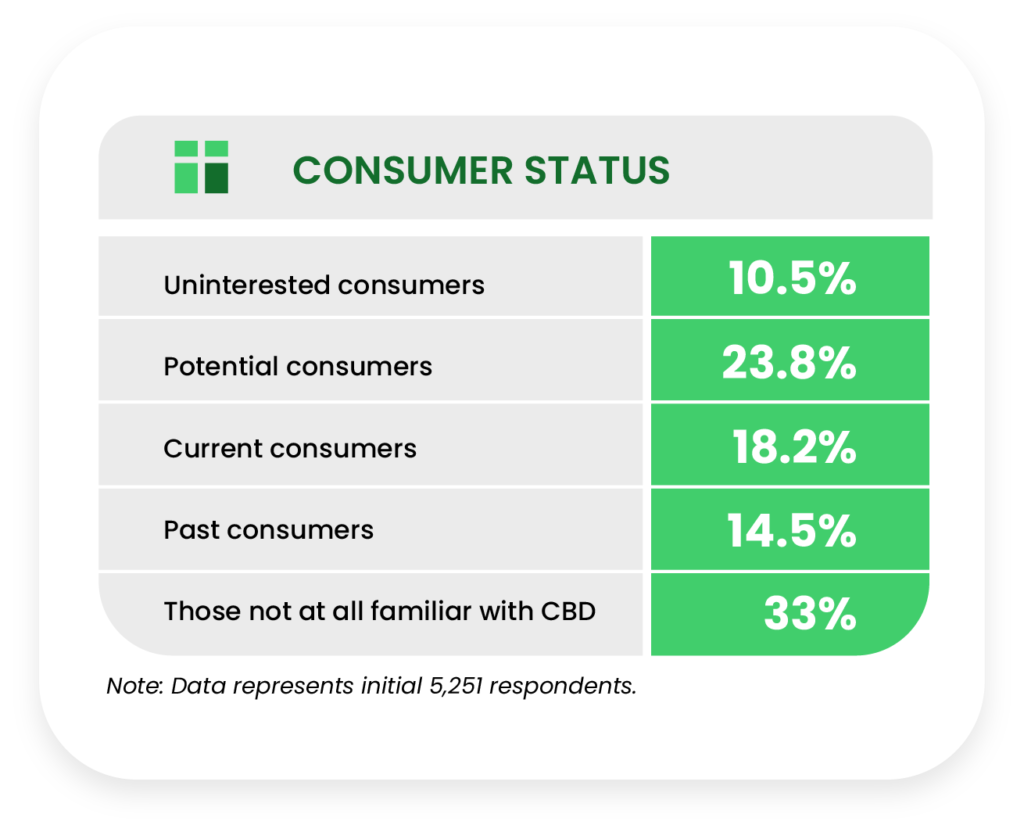
About one-third of Americans have tried CBD (32.7%), another third have never tried but are aware of CBD (34.3%), while the last third have never heard of CBD (33%).
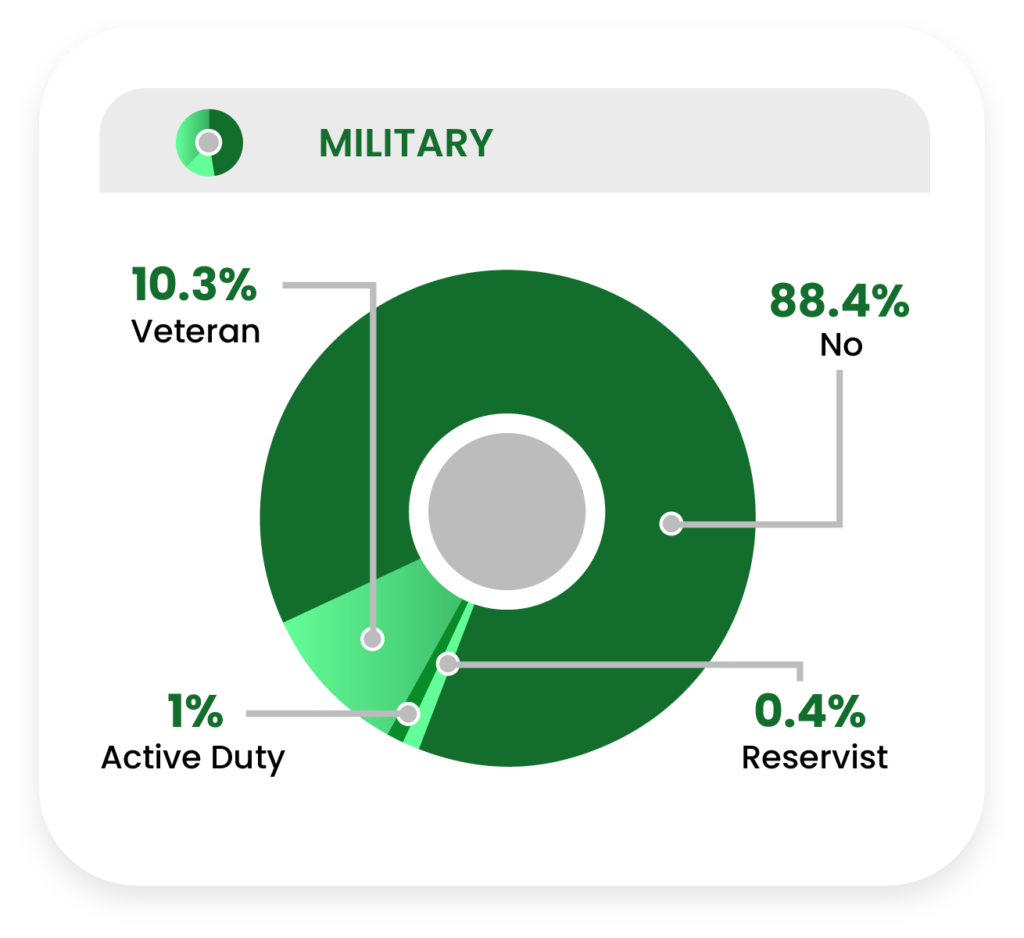
More than one in ten respondents (11.7%) reported a military status: 1% are active duty, 0.4% are reservists, and 10.3% are veterans.
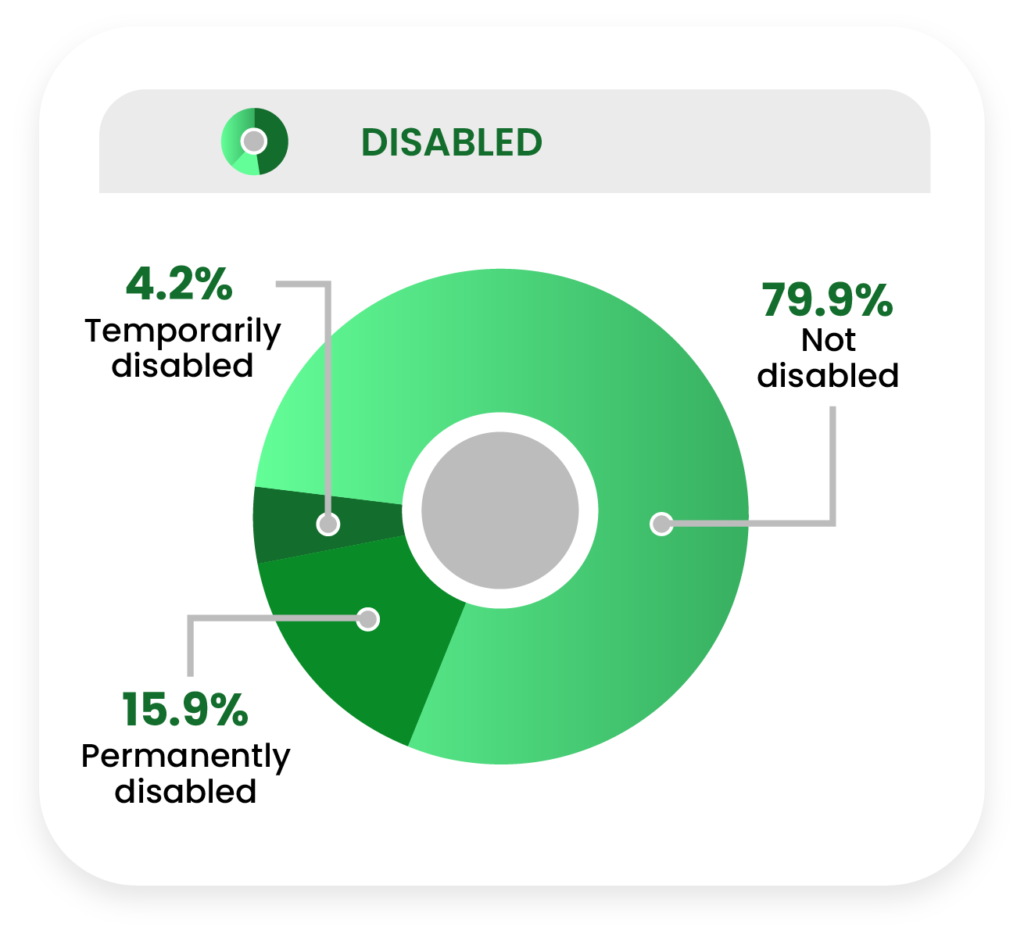
Just over a fifth of respondents (20.1%) reported being temporarily (4.2%) or permanently (15.9%) disabled, compared to the nearly four-fifths (79.9%) who were not disabled.
Part One: CBD in the United States
CBD Awareness and Exposure
All respondents were asked about their awareness of and exposure to CBD in the United States.
Respondents were asked about where they saw CBD for sale, where they would feel comfortable purchasing CBD, and how they gathered information about CBD.
Consumers of CBD products (both current and past consumers) were asked about the type of products they had tried at least once, as well as which product type was their favorite.
Finally, we asked consumers about the CBD brands they recognized, including how trustworthy they found each to be, which ones they had purchased from, and more.
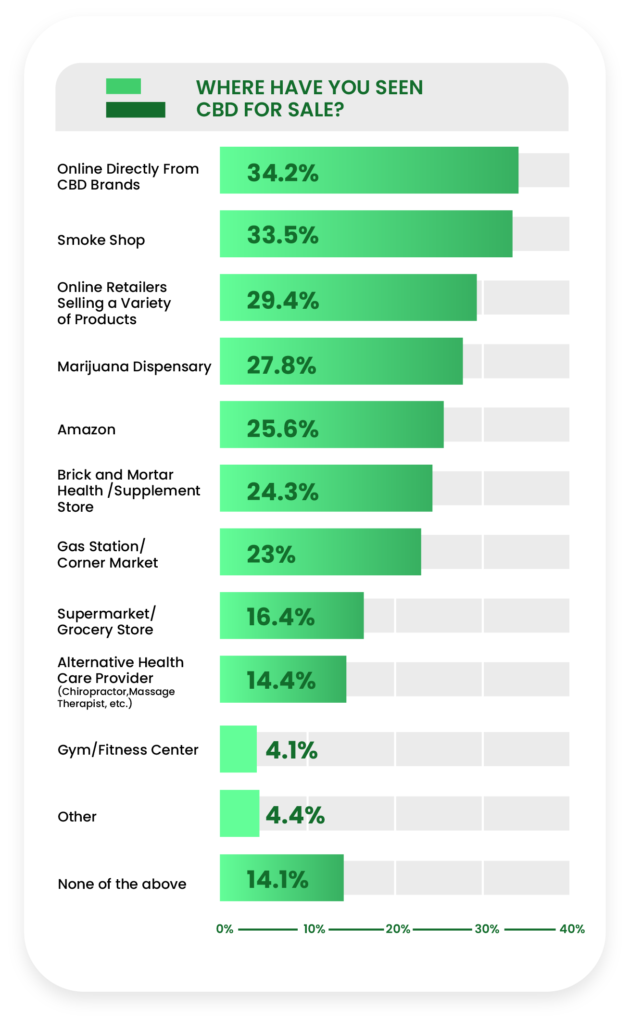
More than one in three respondents had seen CBD for sale on a CBD brand’s website (34.2%), which led smoke shops (33.5%) by a slim margin. Notable runner-ups included online retailers selling a variety of products (29.4%), marijuana dispensaries (27.8%), and Amazon (25.6%).
Compared to the data from last year, a significantly smaller portion of respondents had seen CBD for sale at brick-and-mortar health stores this time around (24.3% vs 35.6%), which can be safely attributed at least in part to the COVID-19 pandemic.
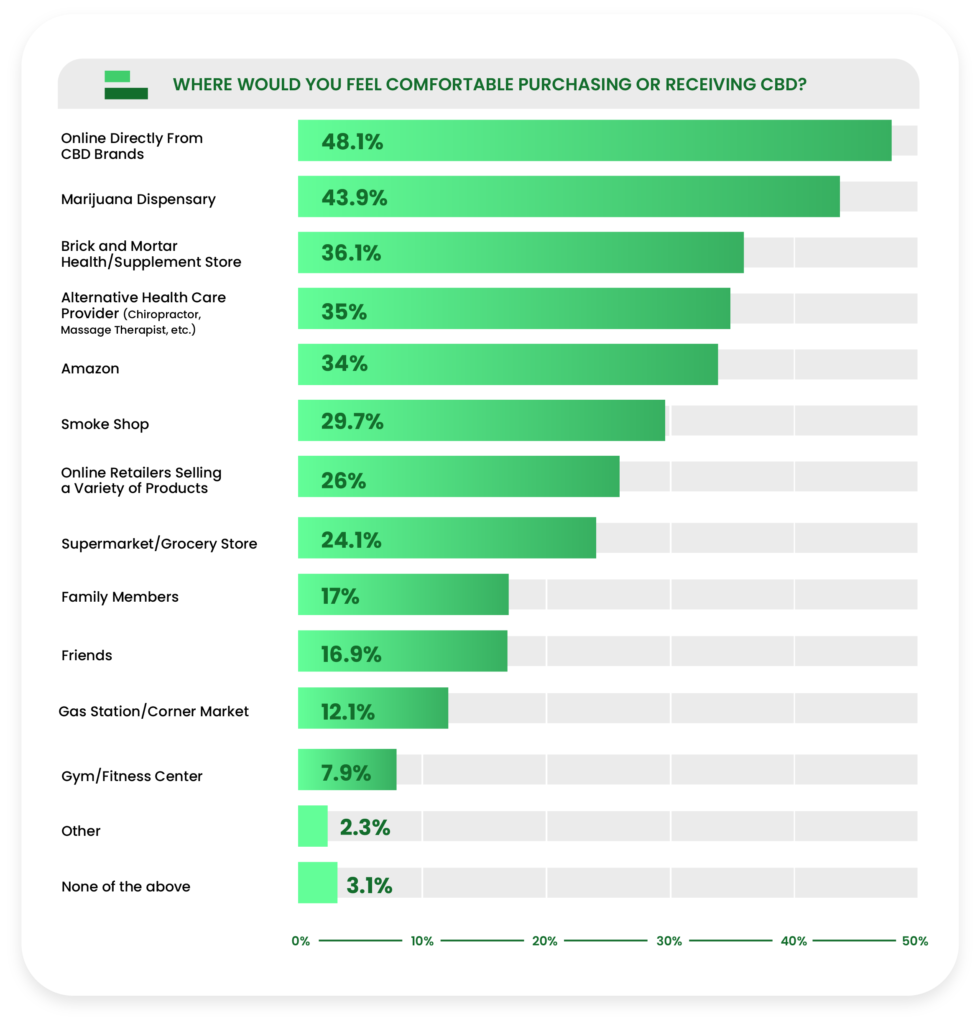
Direct online sales expanded their lead in the arena of consumer preference, as 48.1% of respondents stated they would be most comfortable buying directly from brands online, followed by marijuana dispensaries at 43.9%.
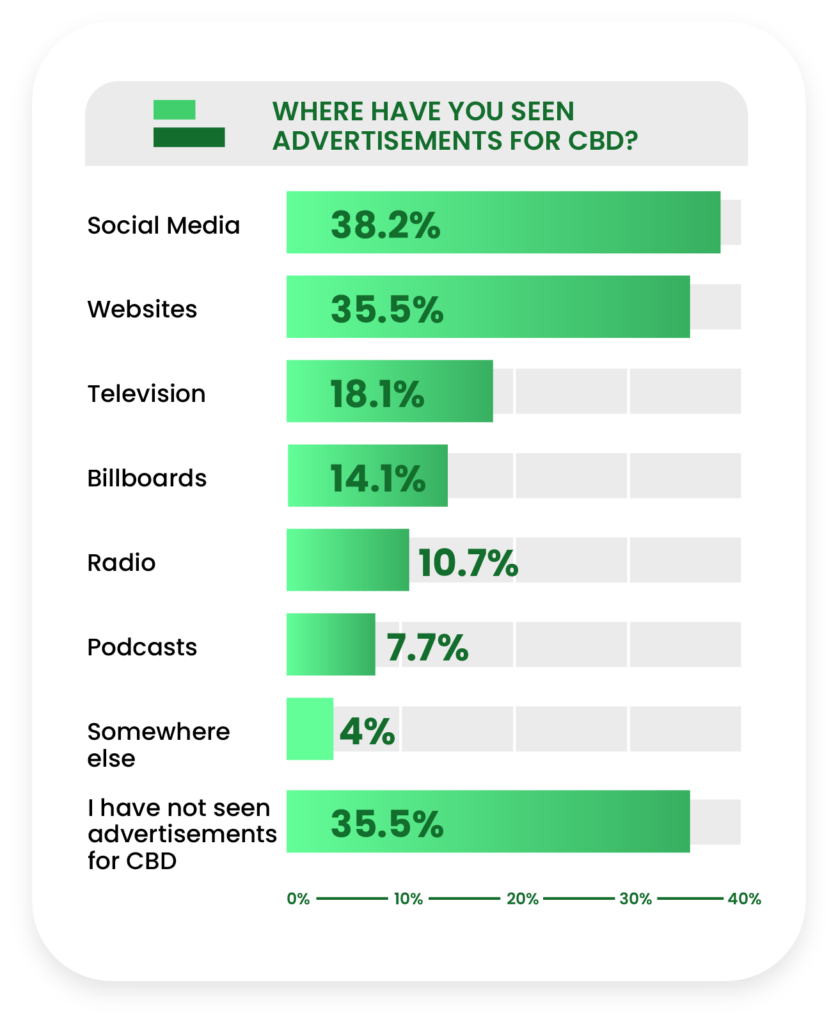
Social media (38.2%) and other websites (35.5%) dwarfed third place (television, 18.1%) in terms of where respondents have been exposed to CBD advertisements.
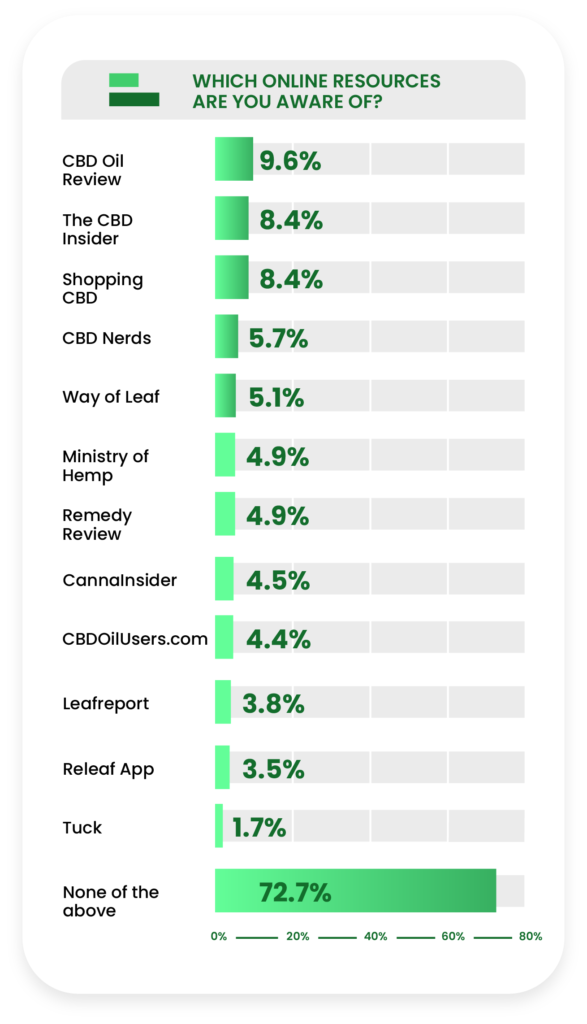
When asked to identify which online CBD information resources they were aware of, the vast majority (72.7%) selected “none of the above.” Otherwise, CBD Oil Review was the most recognized at 9.6%, followed by The CBD Insider at 8.4%.
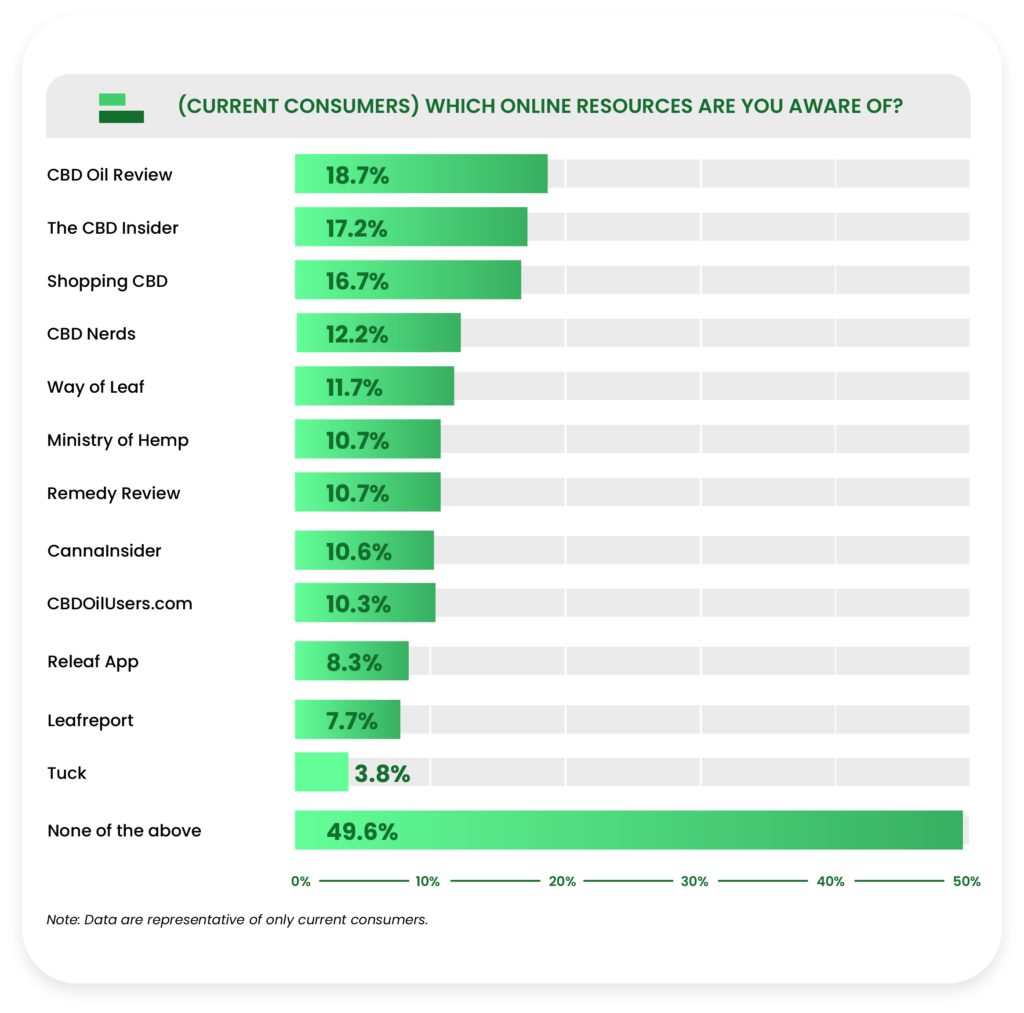
Among current consumers, half of them (50.4%) knew of at least one of the online resources, with CBD Oil Review (18.7%) and The CBD Insider (17.2%) enjoying the most recognition.
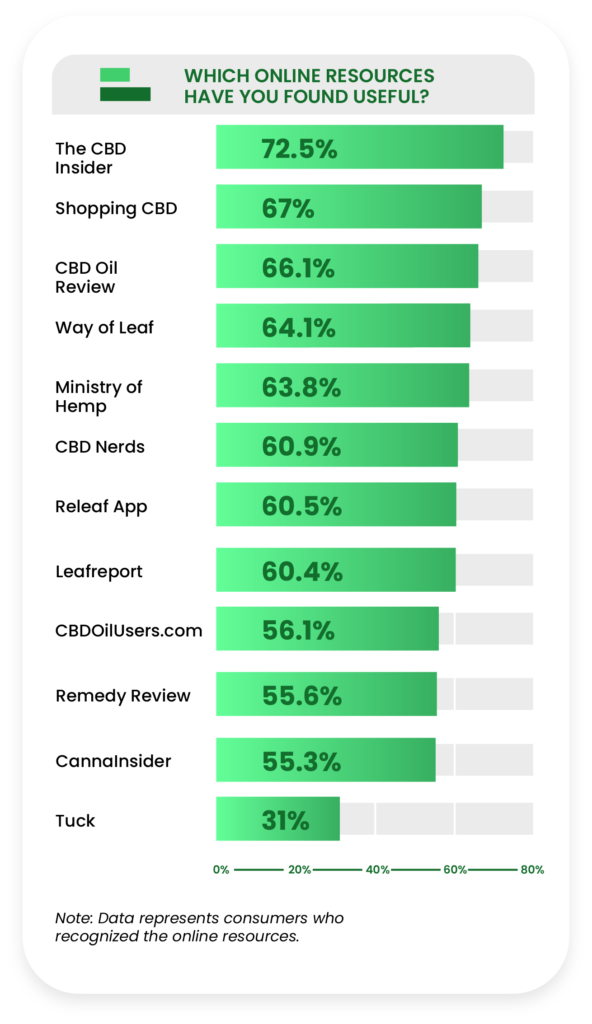
Those who recognized the resources were asked if they found them helpful. The CBD Insider was found to be the most helpful (72.5%) among all respondents.
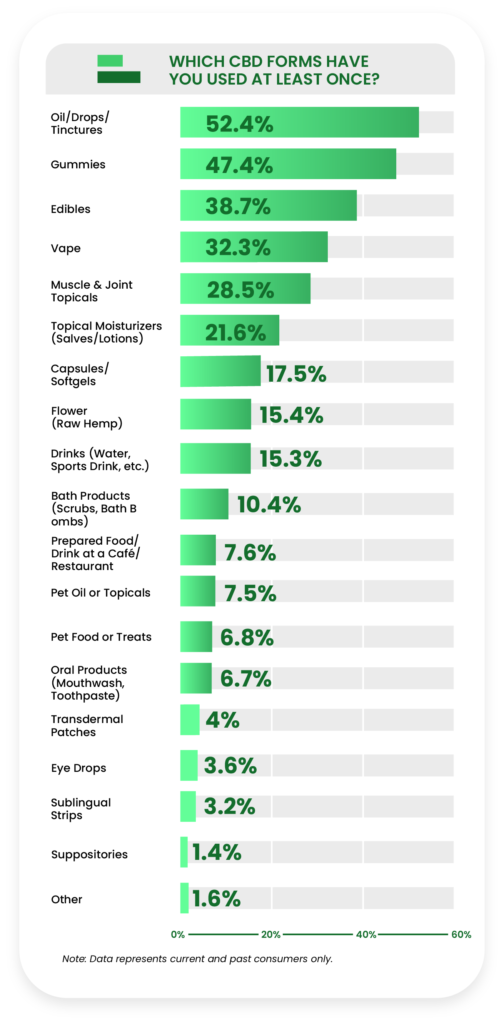
The three most commonly used forms of CBD are oils/drops/tinctures (52.4%), gummies (47.4%), and edibles (38.7%).
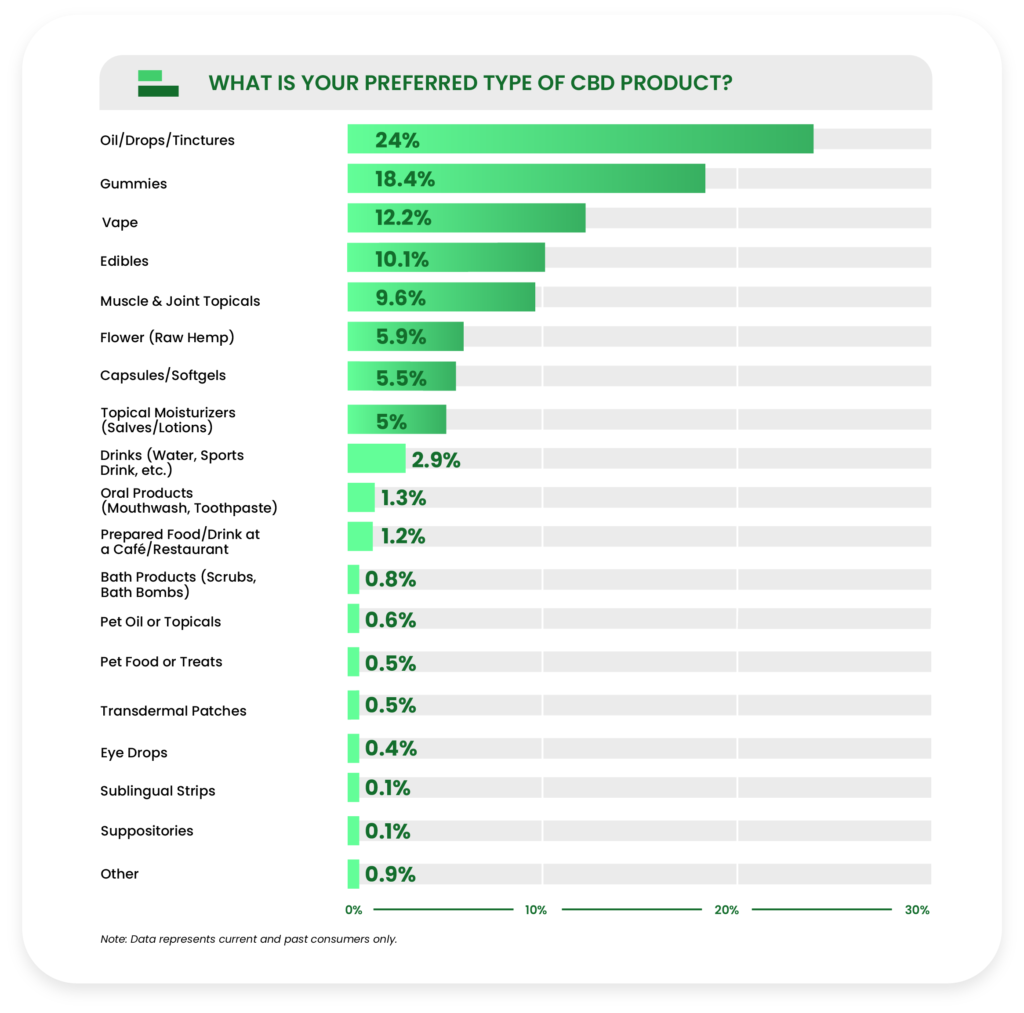
The most preferred product types are oils/drops/tinctures at 24%, gummies at 18.4%, and CBD vape at 12.2%. In our previous report, CBD oils only clung to a thin lead (when answered by only current consumers).
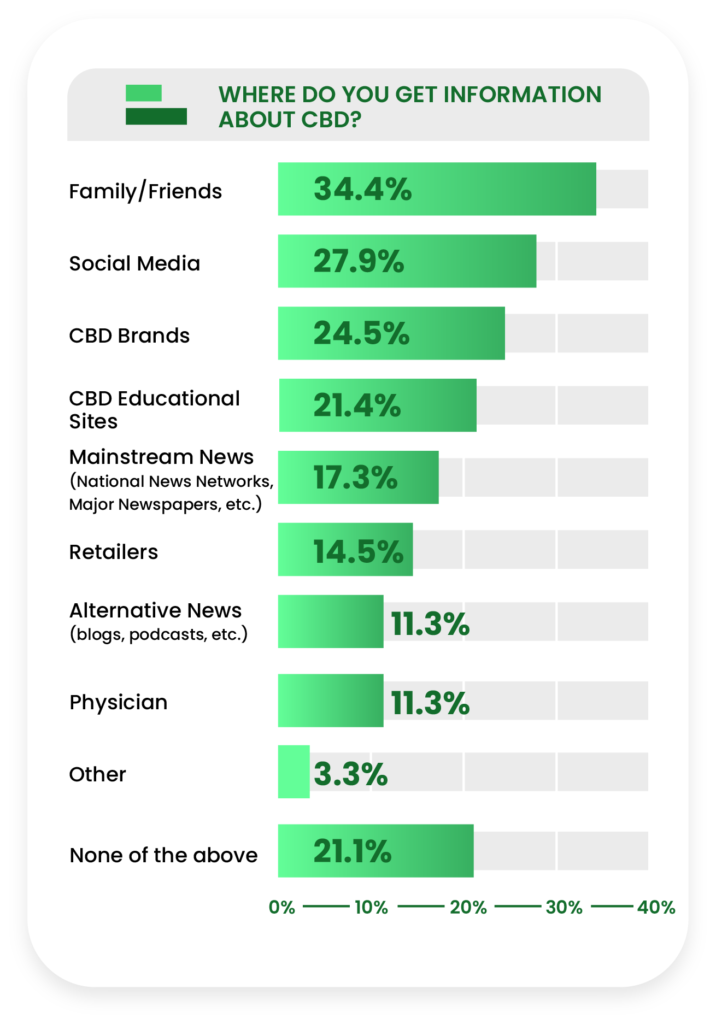
Despite the dominance of online channels as CBD advertising and sales tools, family and friends preside as the top source (34.4%) for information about CBD. Though family and friends were also the most prevalent response in last year’s report, it was a stronger element then (48.8%) than in 2021.
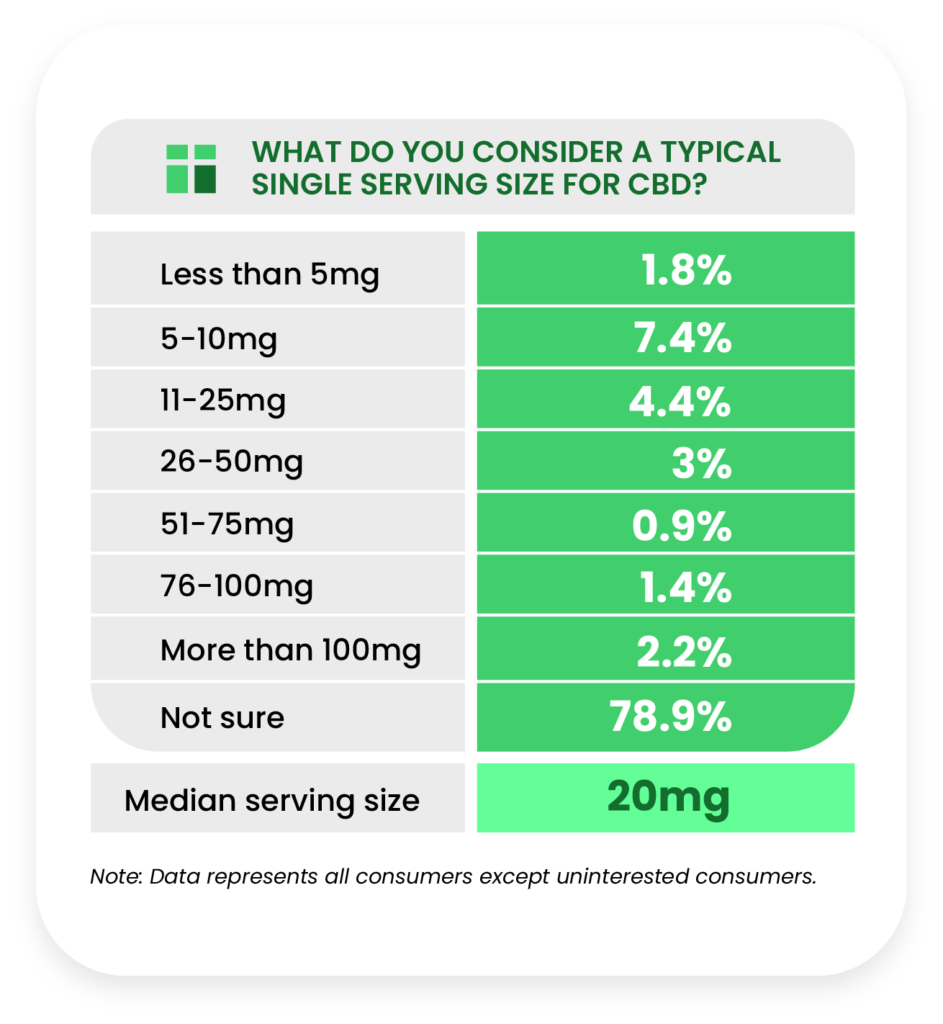
The vast majority of respondents (78.9%) were unsure of what to consider a typical CBD serving size. Among those who mentioned a specific amount, the median serving size was 20mg.
Brand Awareness
All respondents (except where specifically noted) were asked to name and identify CBD brands they were aware of, as well as express their sentiment toward them.
Consumers were also surveyed about their buying habits concerning the brands and which one they considered their favorite.
We compiled our list of 34 brands based on the legitimacy of the company and their digital and retail presence.
Compared to the previous report, this list substantially expanded, signifying the growth of the CBD market over the last 12 months.
We expect this list to consolidate in coming reports as pending regulations force out brands that are unable to meet them.
Let’s begin with the brands respondents were most aware of when they were not aided by a list.
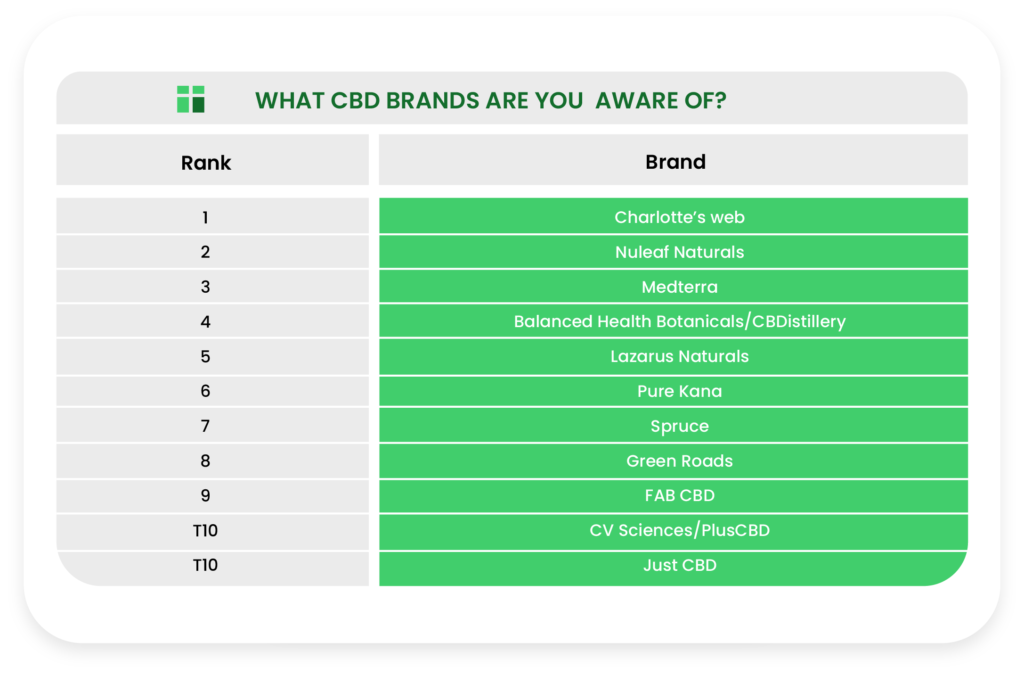
When asked to list the CBD brands they were aware of unaided, respondents mentioned Charlotte’s Web, Nuleaf Naturals, Medterra, Balanced Health Botanicals/CBDistillery, and Lazarus Naturals the most in that order.
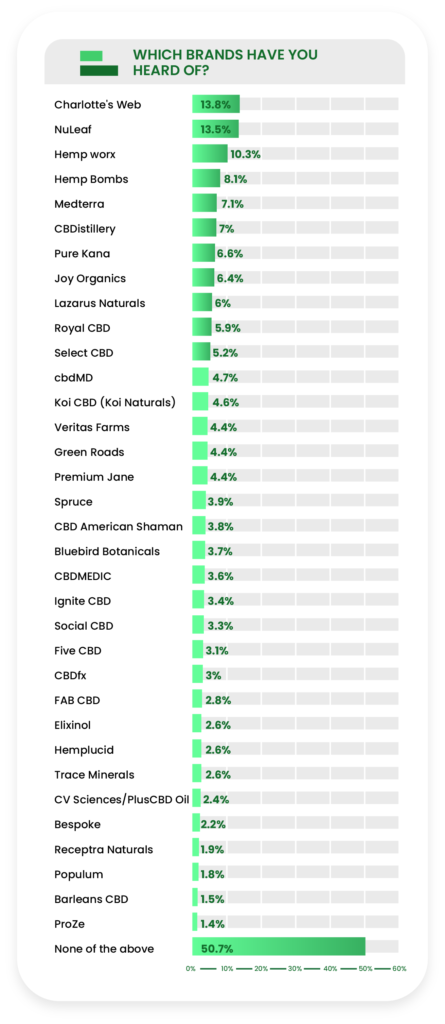
When provided with a list of CBD brands, the most recognized were Charlotte’s Web (13.8%), NuLeaf (13.5%), and Hempworx (10.3%). Just over half of all respondents (50.7%) selected “none of the above.”
In our previous report, only current consumers answered this question; however, Charlotte’s Web and Nuleaf were still the most popular brands.
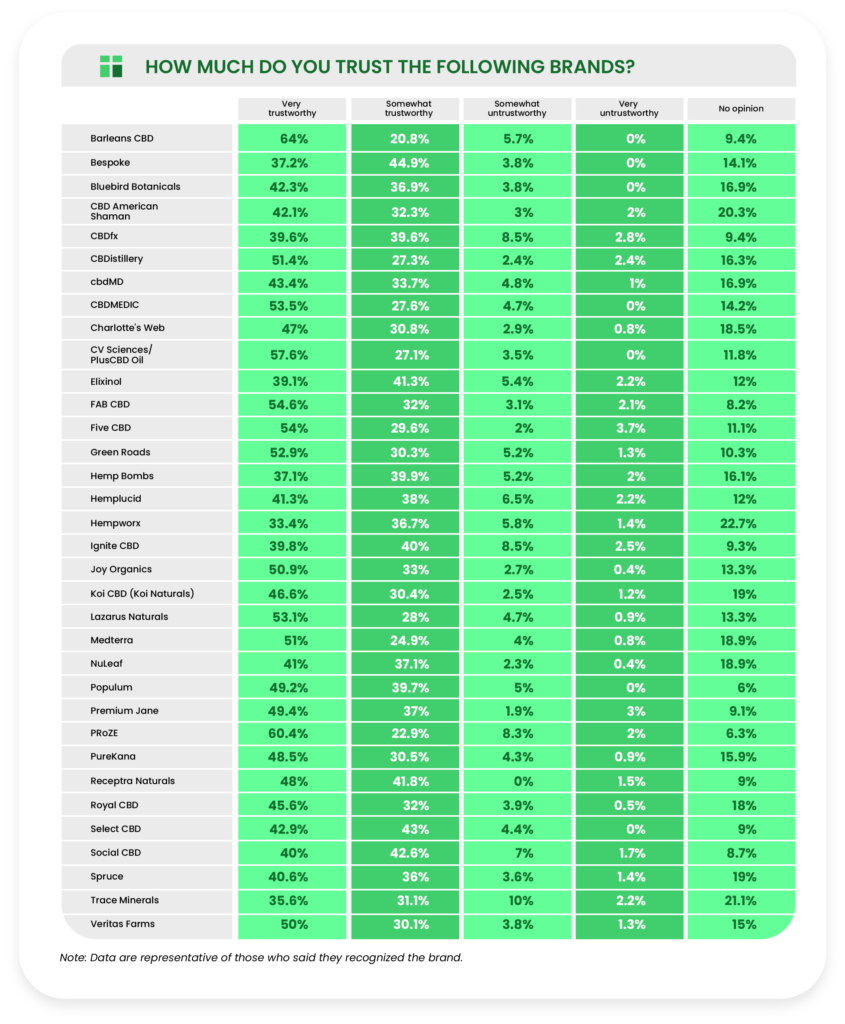
Among those who recognized a given brand, the majority of consumers considered every CBD brand trustworthy to some degree.
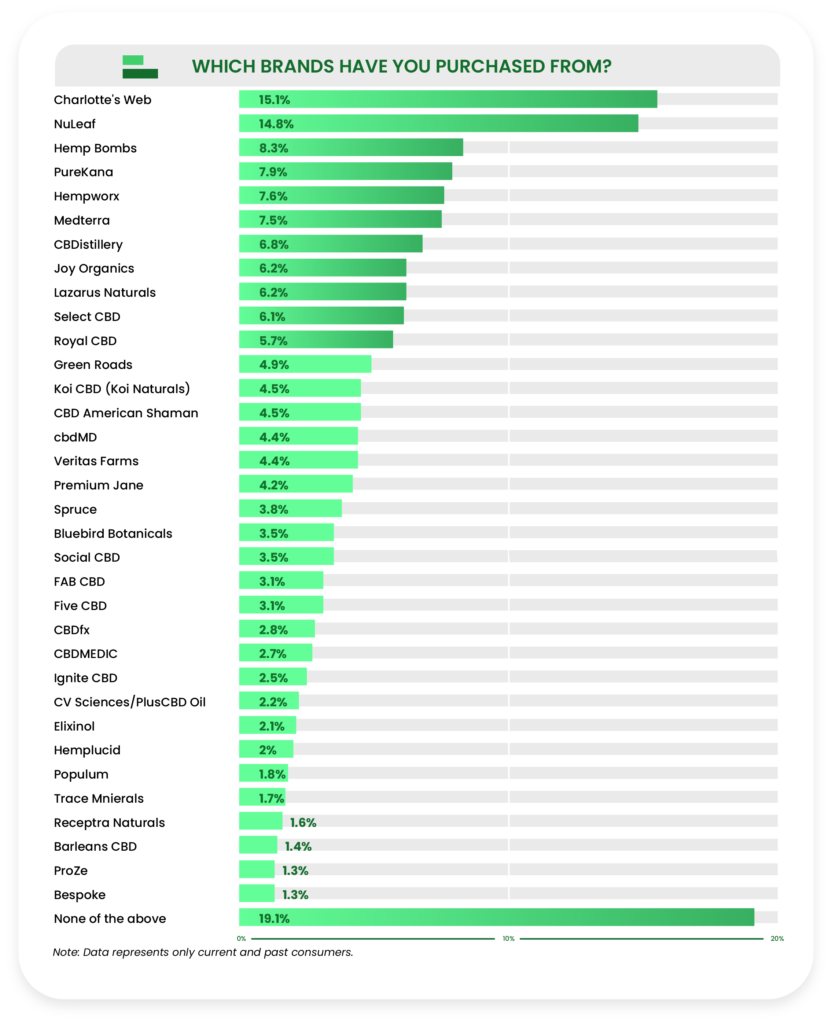
Charlotte’s Web (15.1%) and NuLeaf (14.8%) led the field for brands that respondents purchased from the most, followed by Hemp Bombs (8.3%).
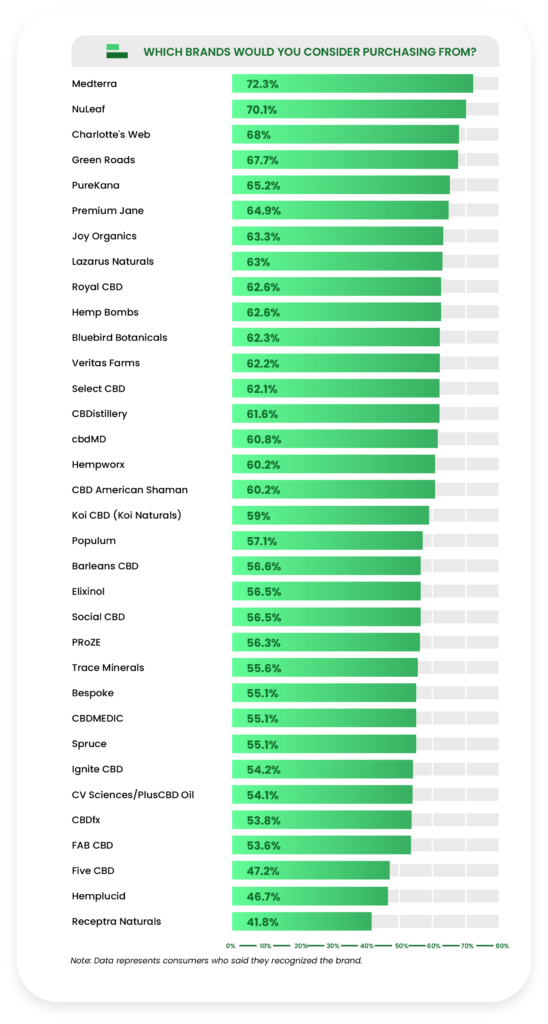
When asked who they would consider purchasing CBD from, respondents were most likely to buy from Medterra (72.3%), NuLeaf (70.1%), and Charlotte’s Web (68%).
The majority of consumers who recognized these brands said they would consider purchasing from them, except for Five CBD, Hemplucid, and Receptra Naturals.
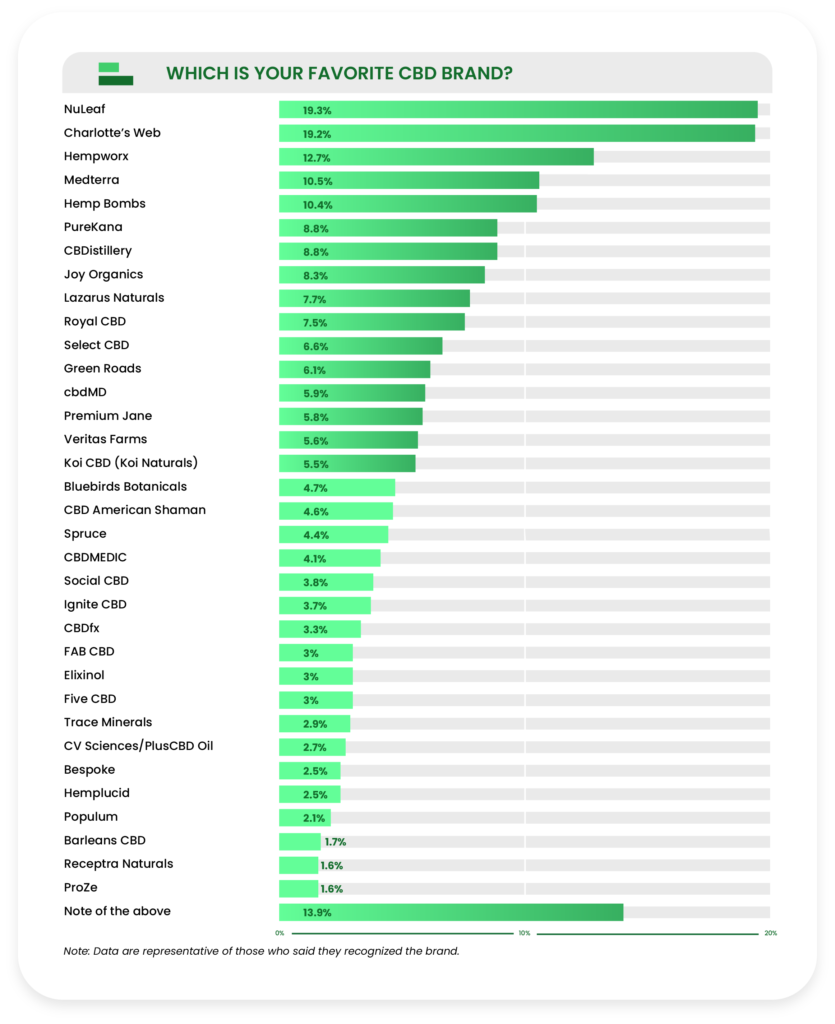
Nuleaf was most often selected (19.3%) when respondents were asked to pick their favorite brand, barely beating out Charlotte’s Web (19.2%).
Sentiment Toward CBD
Consumers were surveyed about their feelings toward CBD itself, including concerns about products, THC, legality, and more.
Respondents also gave their thoughts about the industry in general, specifically about FDA regulations.
We also gauged what factors would most influence a potential purchase and how much respondents would be willing to pay for a month’s worth of products.
Interestingly, consumers expressed their lack of willingness to use CBD vape pens, a controversial topic that has been further complicated by recent legislation.
Finally, we asked consumers to agree or disagree with a series of statements ranging from sentiment about CBD-related laws to their beliefs about how CBD could affect their bodies.
Let’s start with the consumers’ attitudes towards FDA regulations.
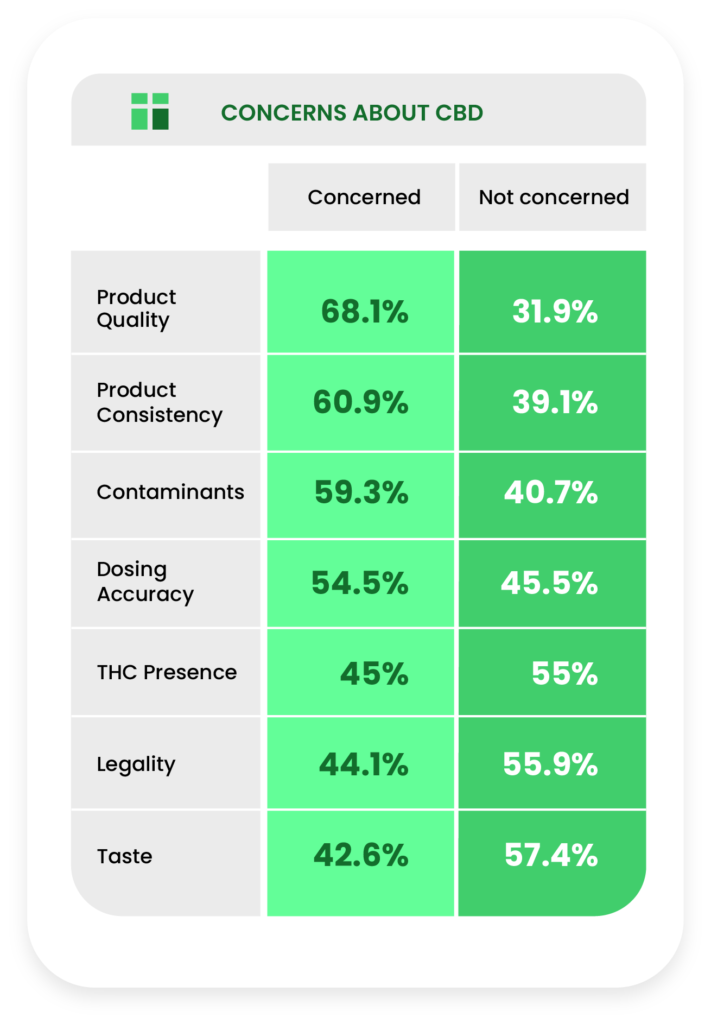
Despite the almost fervent efforts of researchers and the FDA to study, regulate, and inform the public about CBD, we still didn’t see official regulation in 2020. As such, consumers are still very concerned about product quality (68.1%), product consistency (60.9%), and contaminants (59.3%) above all other potential issues.
Less than half of consumers are concerned about topics like the presence of THC in products and CBD’s legality.
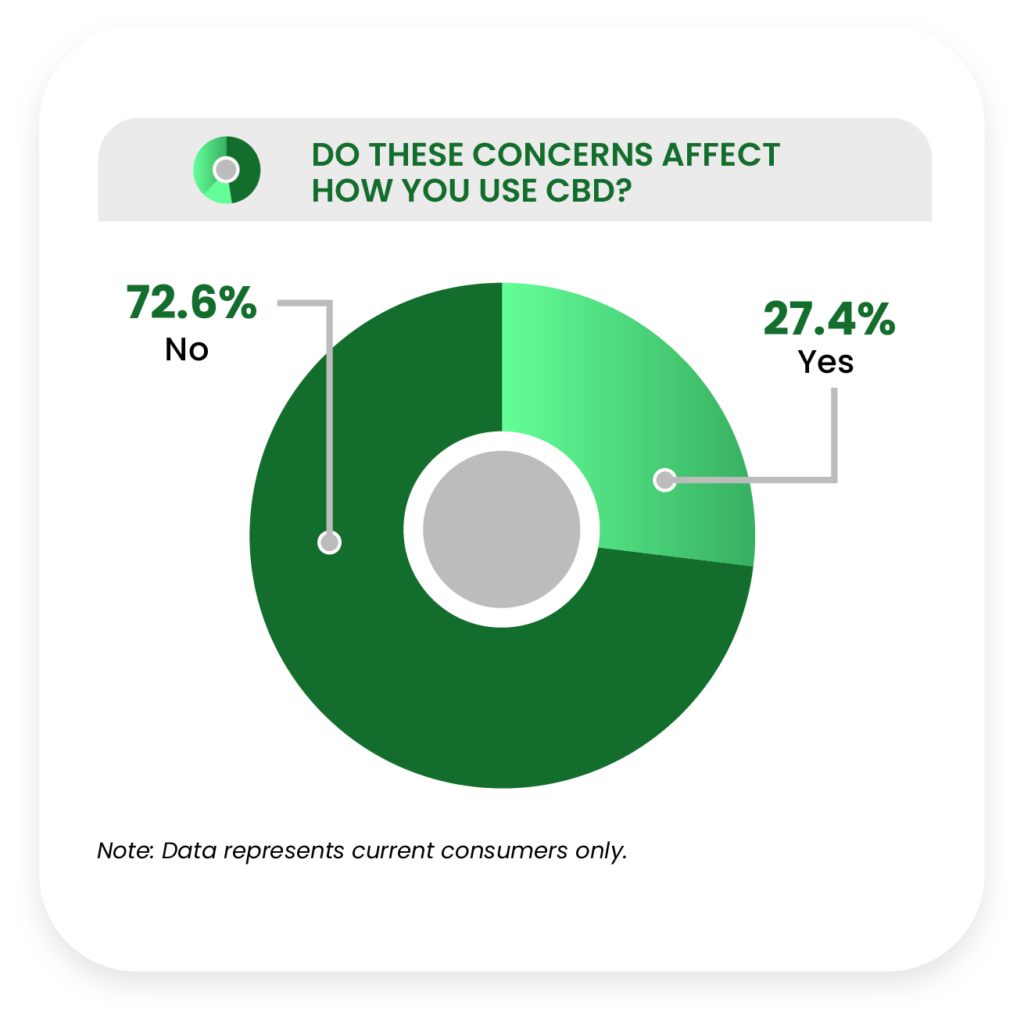
Among current consumers, only a little more than a quarter of them (27.4%) say that these concerns affect how they use CBD.
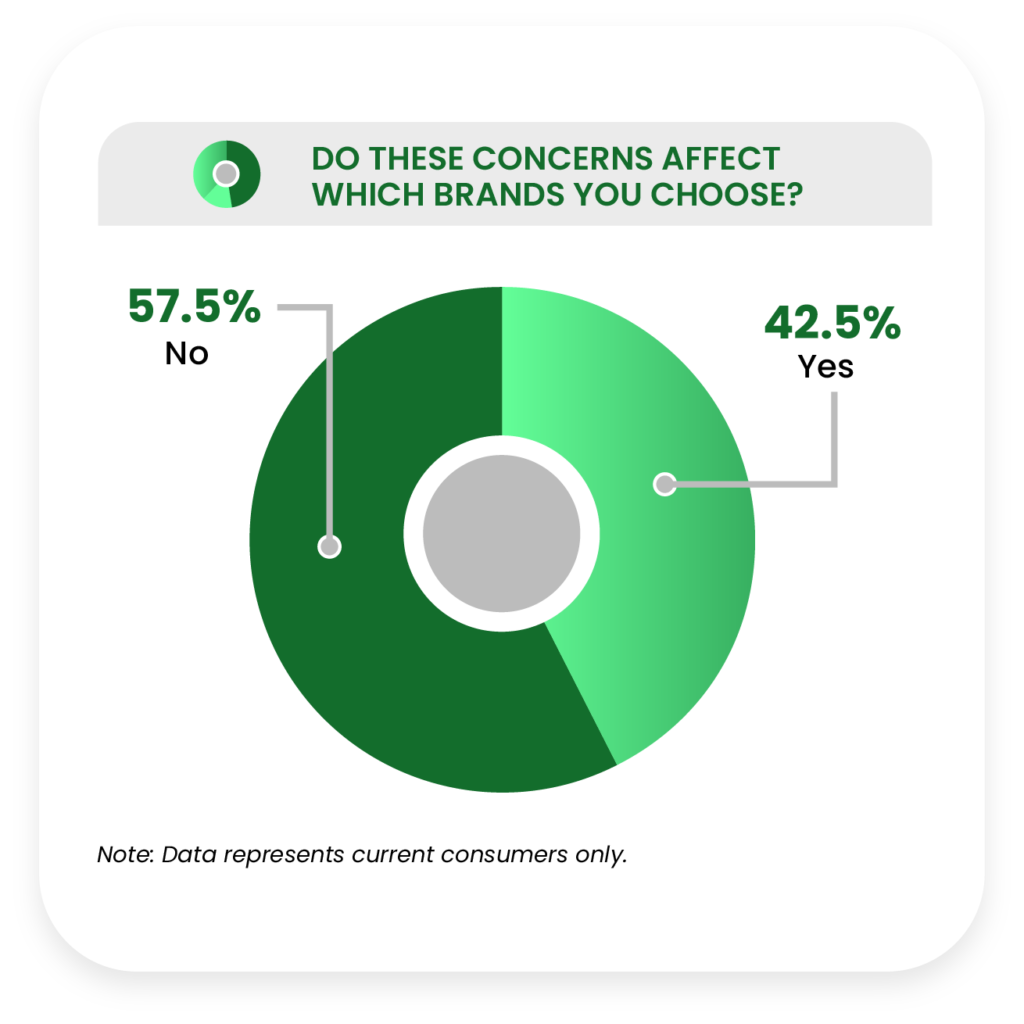
Less than half (42.5%) say these concerns affect which CBD brands they purchase from.
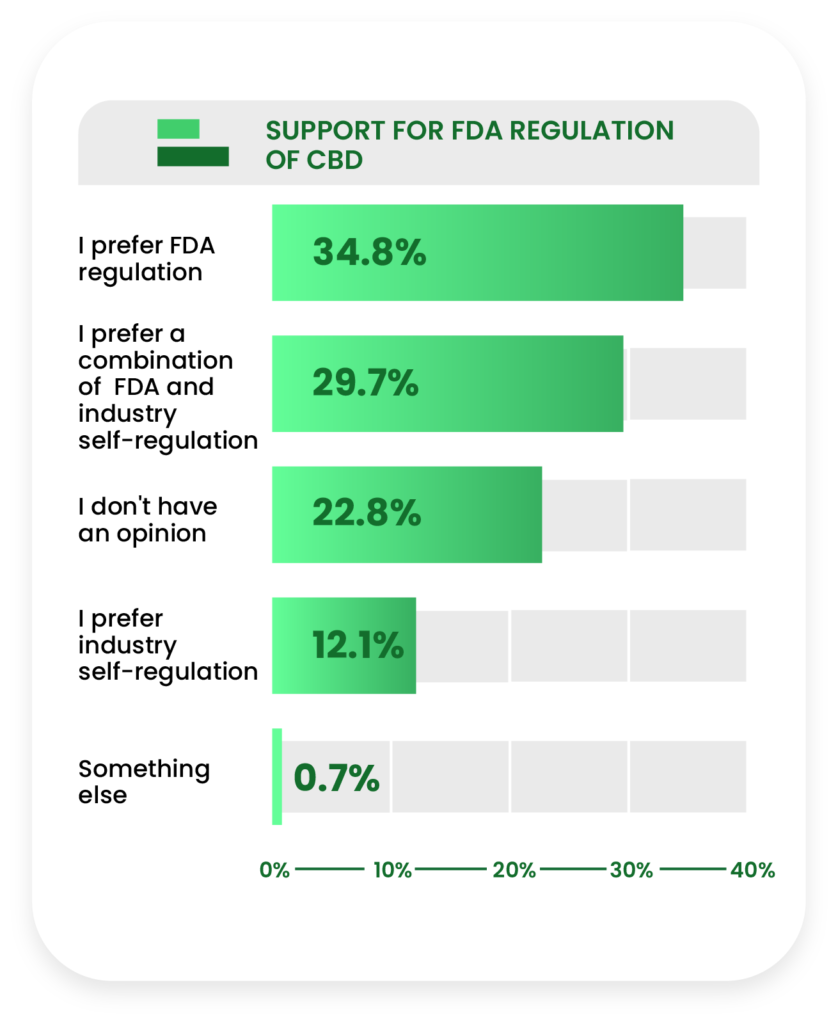
Respondents indicated that they still want the FDA to have a hand in CBD regulation, with 34.8% voicing their desire for FDA regulation and 29.7% claiming they would prefer a combination of FDA and industry self-regulation. This is compared to 12.1% of respondents who stated they would prefer the industry to regulate itself without the FDA.
Nearly a quarter of consumers (22.8%) said they have no opinion on the matter.
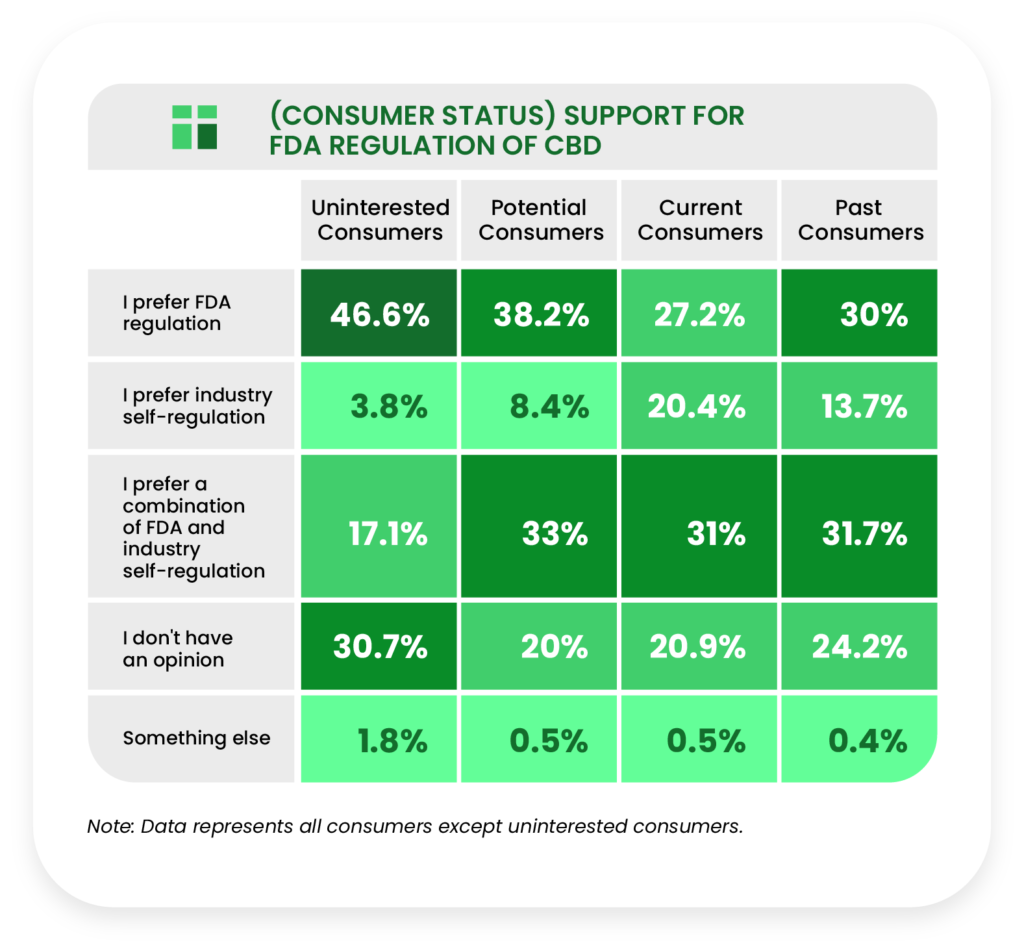
When analyzing by consumer status, uninterested consumers were significantly more likely to prefer FDA regulation, while those who preferred that the industry self-regulate were more likely to be current or past consumers.
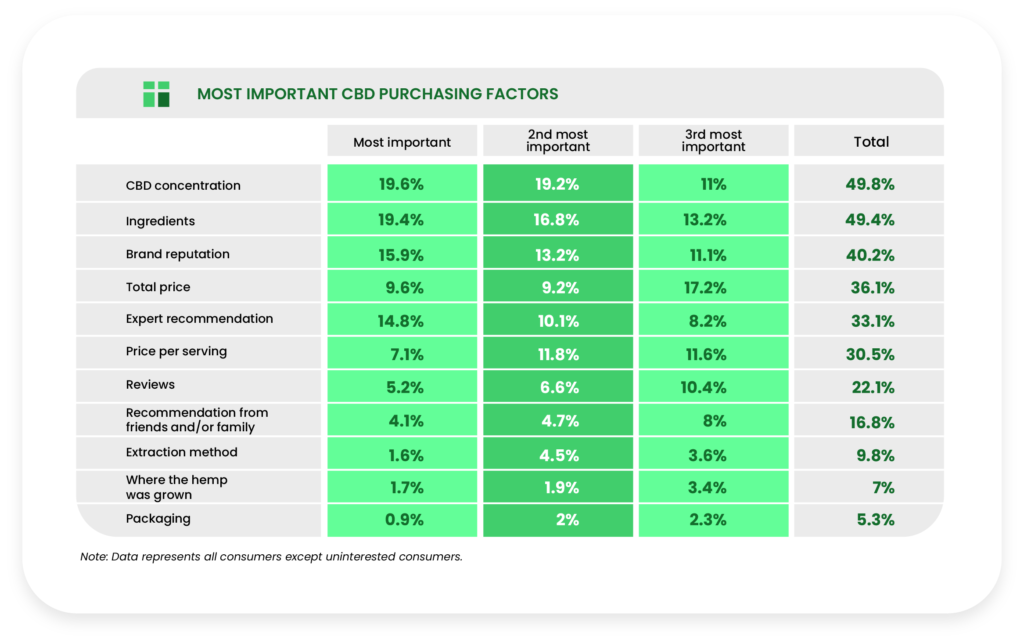
Considering the risks of this pre-regulation environment, respondents leaned heavily on brand reputation (15.9%) and ingredients (19.4%) when asked about their three most important considerations prior to a CBD purchase, but concentration (19.6%) actually led the field by a slim margin.
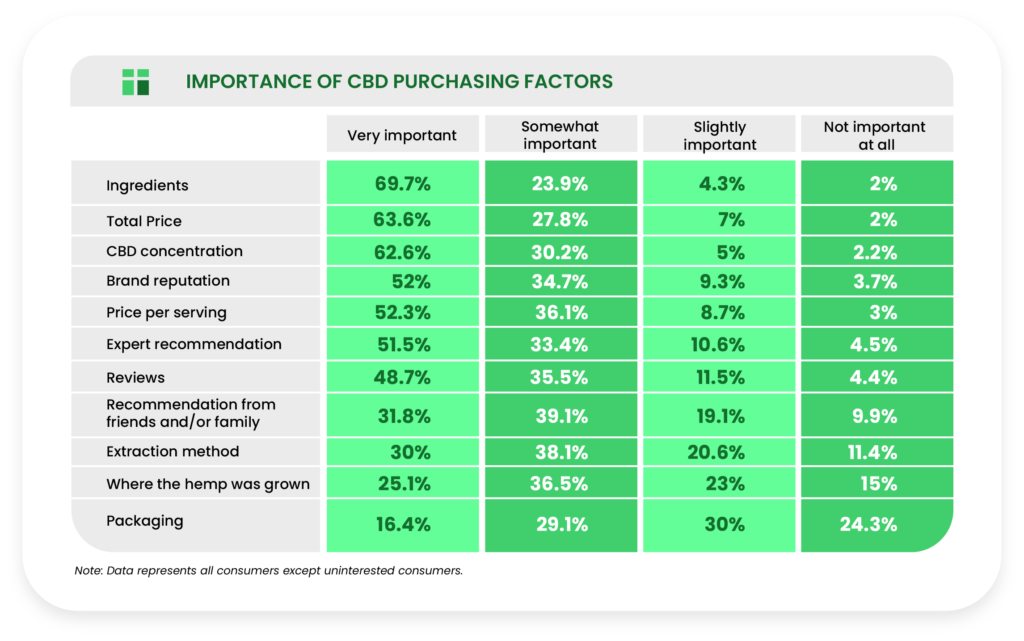
When asked to rate how important these purchasing factors were, ingredients (69.7%) and total price (63.6%) surpassed concentration (62.6%) as “very important” factors in a purchasing decision.
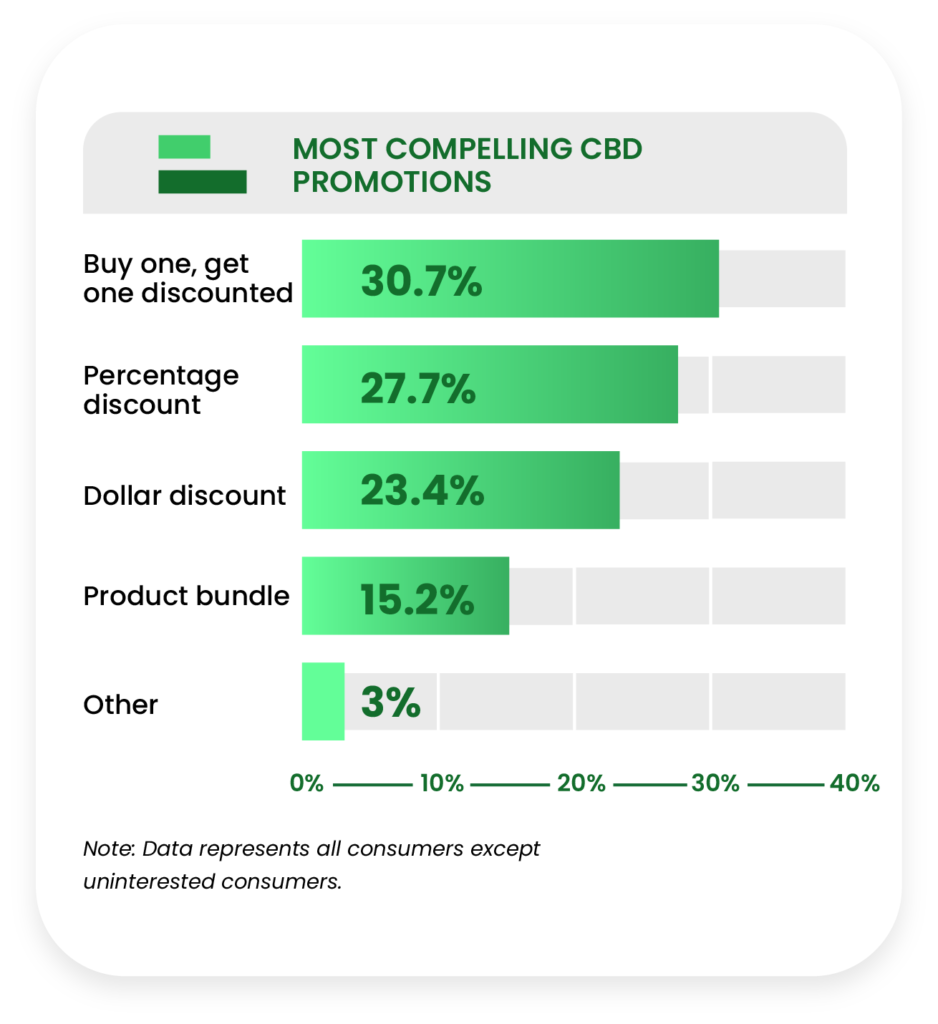
The cross-industry success of BOGO (buy one, get one free) promotions holds steady in the CBD market (30.7%), but only led percentage discount by three points (27.7%) when respondents were asked which promotion would make them most likely to make a purchase.
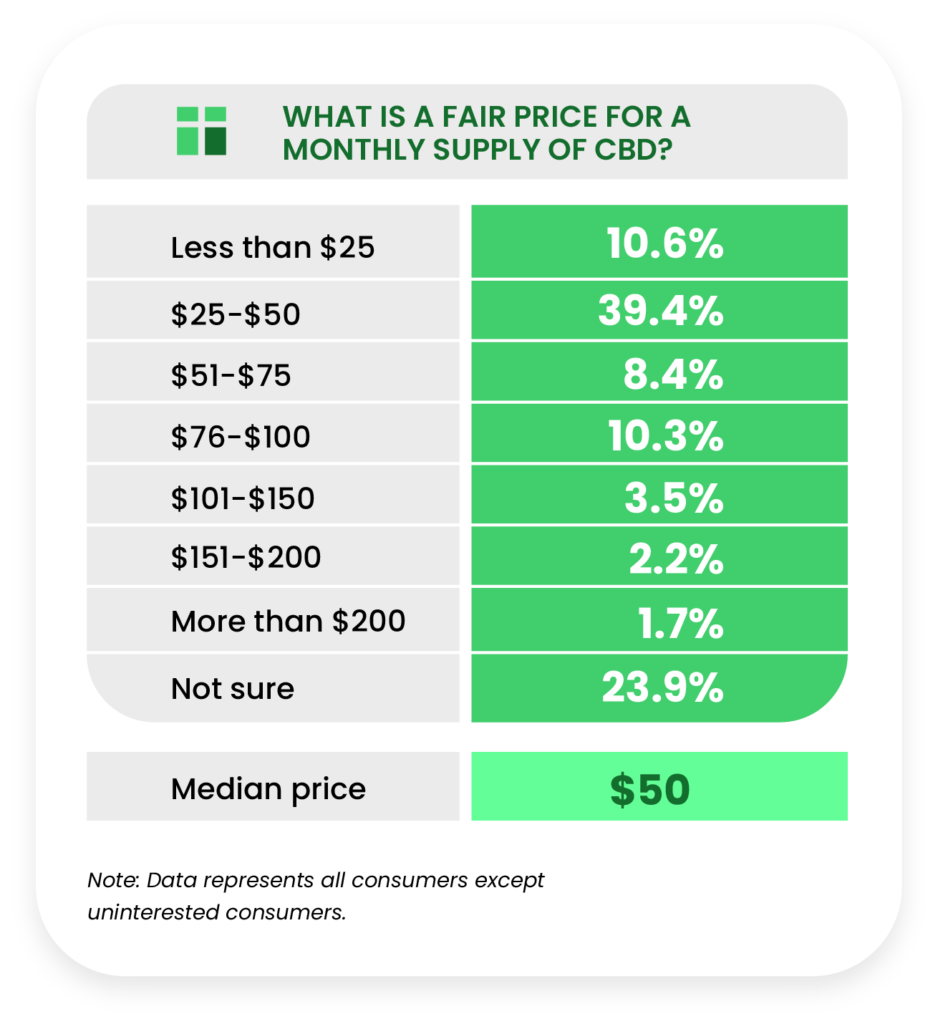
Just under a quarter (23.9%) of all respondents were unsure of what a fair price for one month’s worth of CBD would be, and the remaining 76.1% settled around a median price of $50.
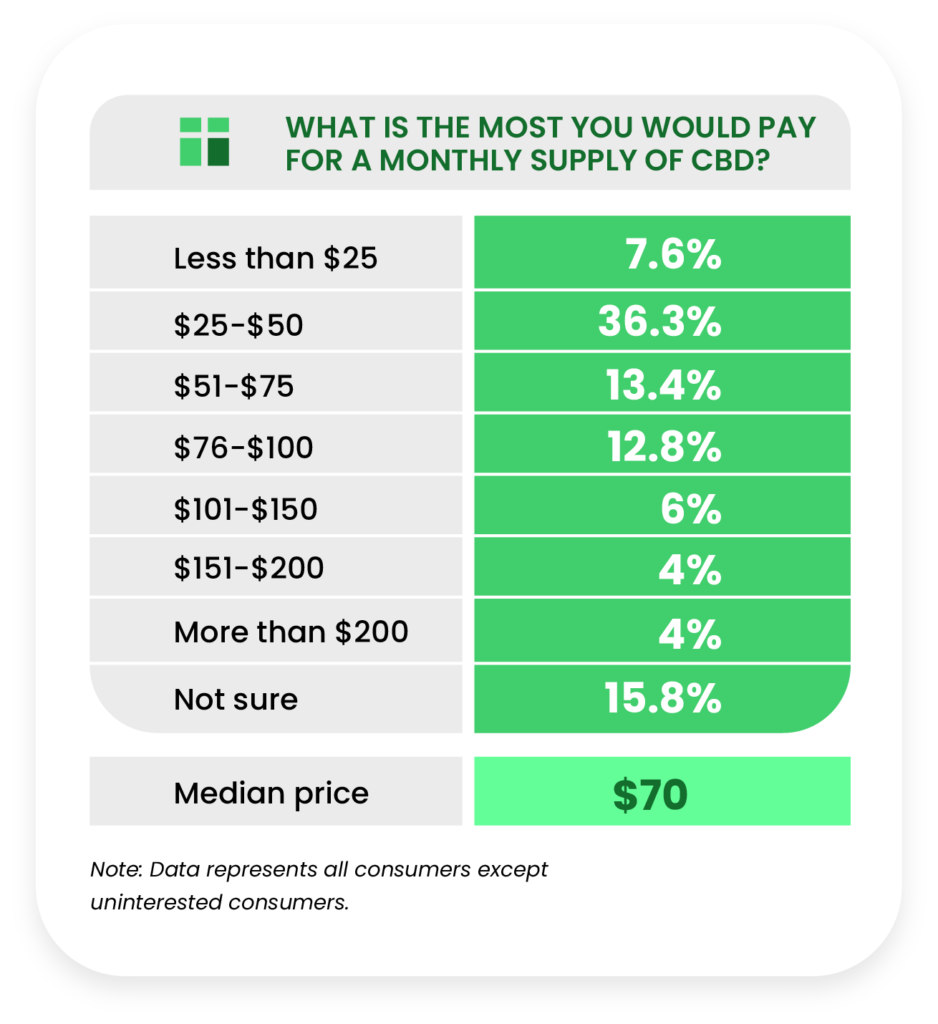
Predictably, the respondent pool was less uncertain (15.8%) about the maximum amount they’d be willing to pay for one month’s worth of CBD. The median price was $70.
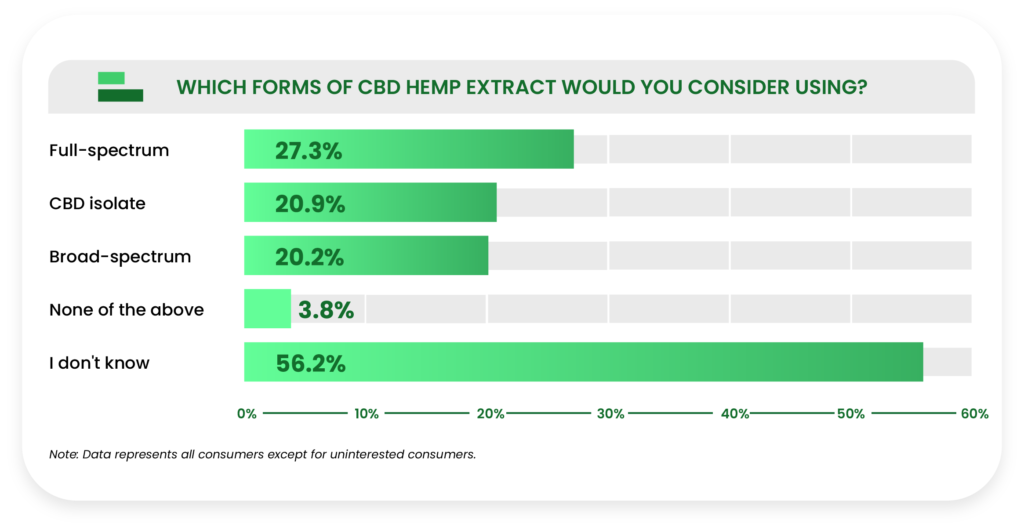
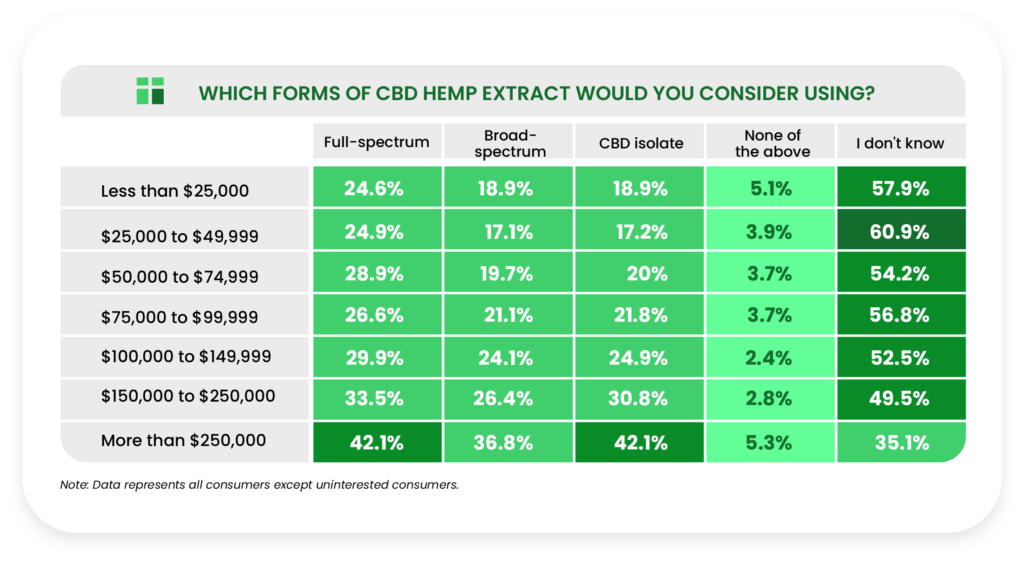
Another potential symptom of the lack of government-supported CBD guidelines and informational resources is the striking number of respondents (56.2%) who selected “I don’t know” when asked which type of hemp extract they would consider using (full-spectrum, broad-spectrum, or isolate). Excluding this large swath of participants, the results were relatively predictable, with full-spectrum (27.3%) leading CBD Isolate (20.9%) and broad-spectrum (20.2%).
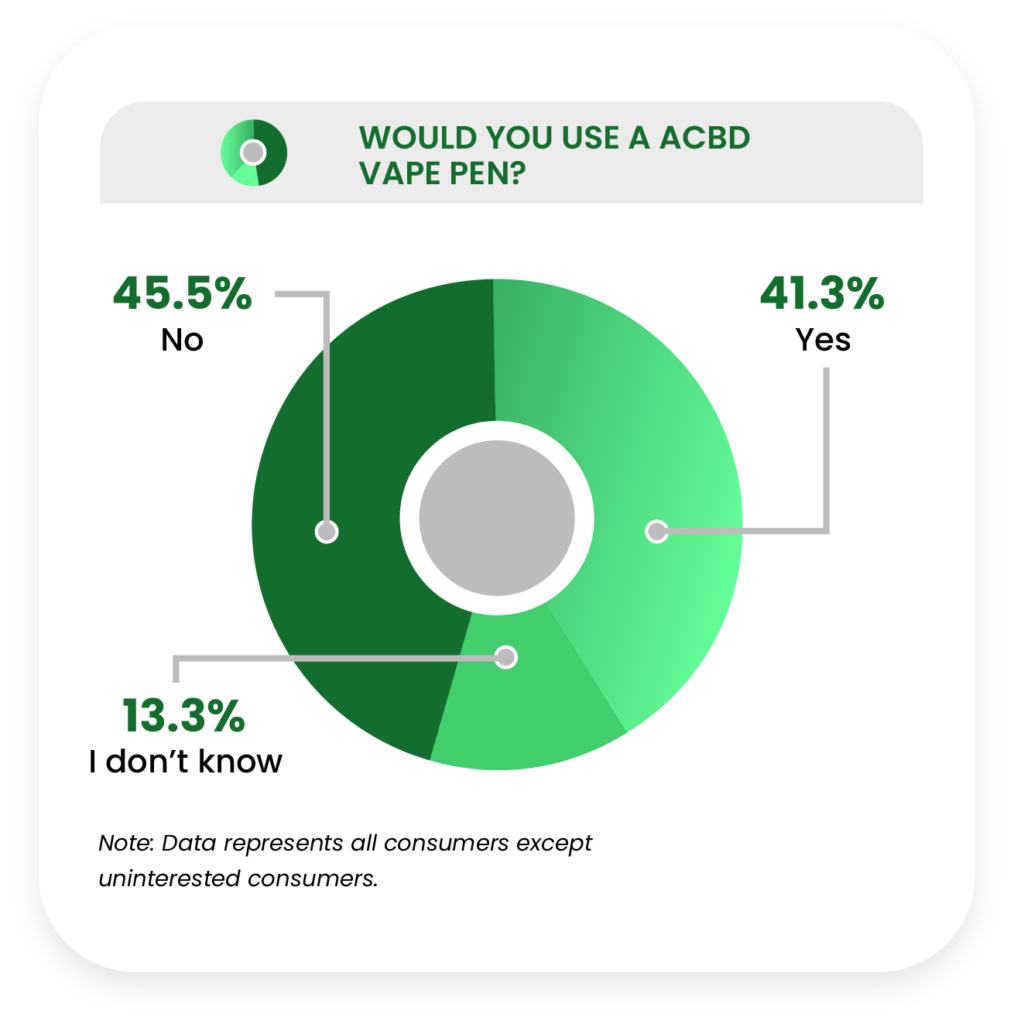
The crowd was split fairly evenly on the matter of CBD vape pens, with 41.3% stating they would consider using one and 45.5% stating they would not.
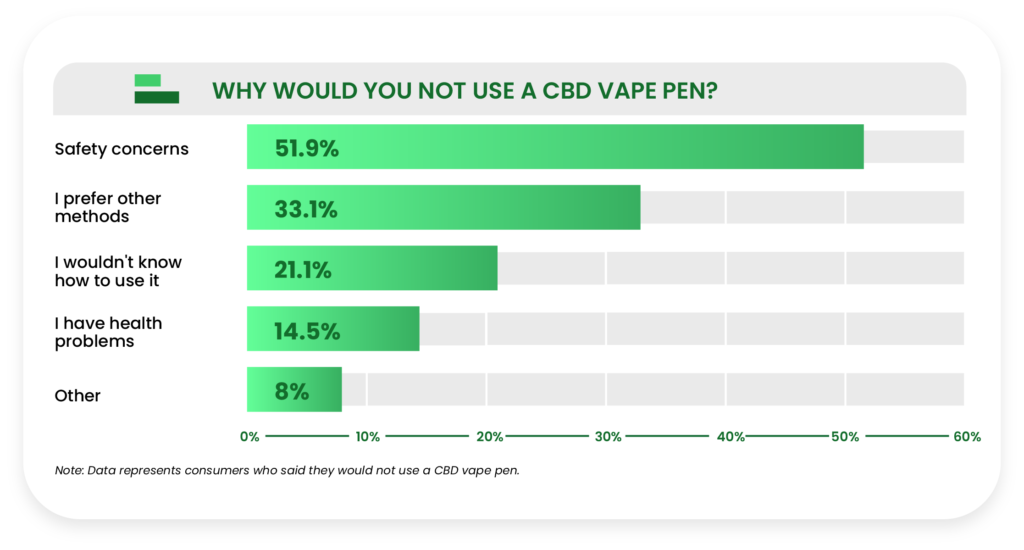
Among the respondents who expressed they would not use a CBD vape pen, the greatest issue was safety concerns (51.9%), followed by a preference for other delivery methods (33.1%) and not knowing how to use a vape pen (21.1%).
Statements About CBD
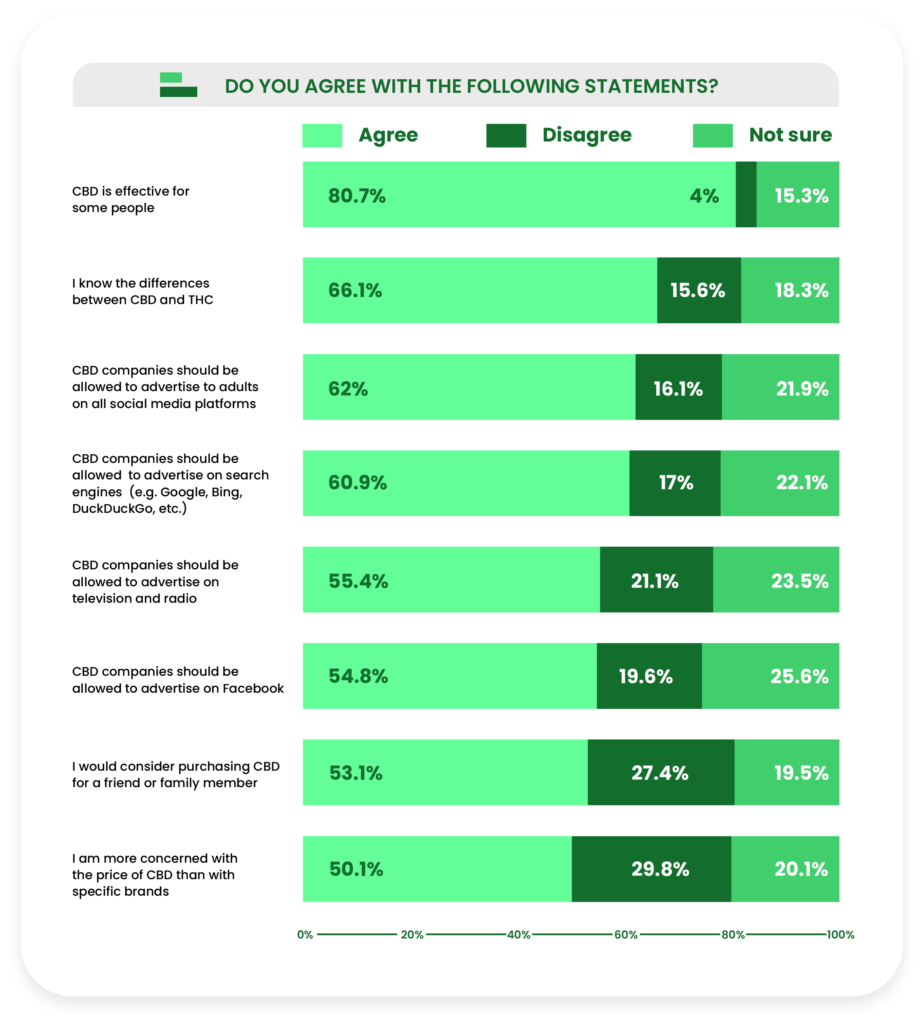
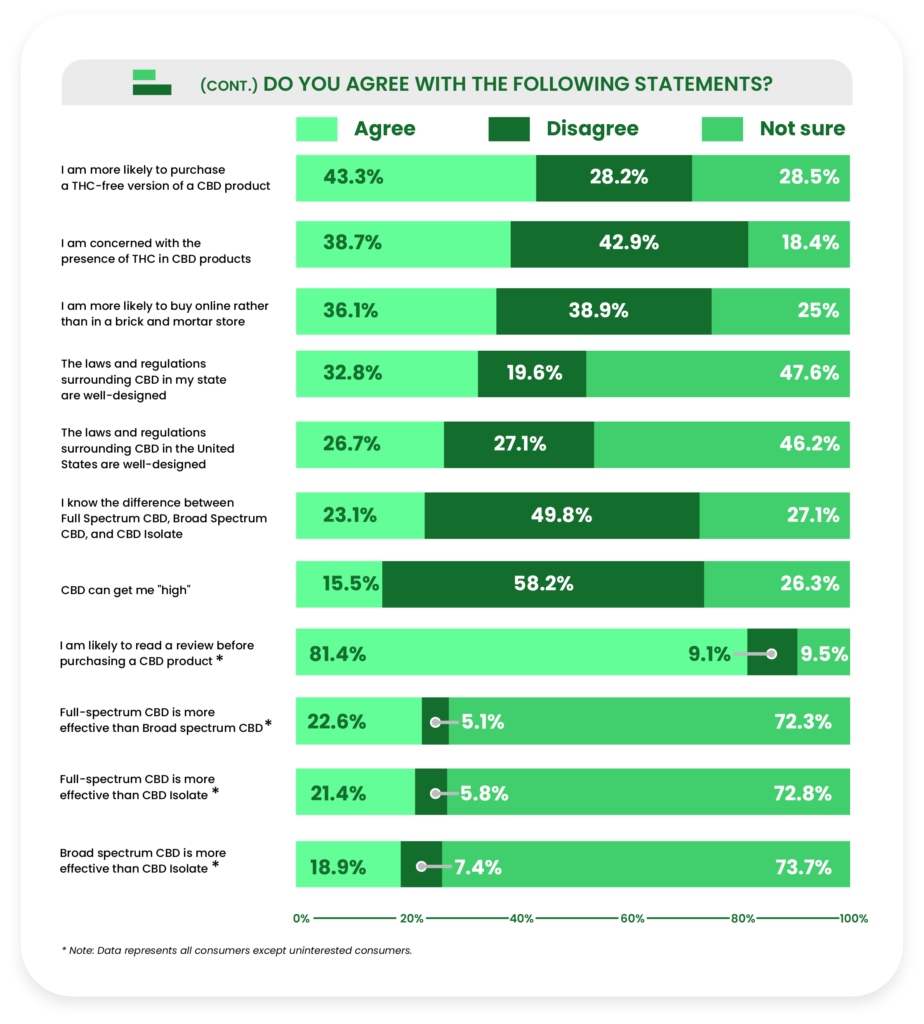
Finally, we asked our respondents whether or not they agreed with 19 statements relating to CBD legality and regulation, effectiveness, and their own knowledge of/attitudes toward cannabidiol. Following are the most glaring trends we observed in their responses:
- More than four out of five respondents (80.7%) agreed that CBD is effective for some people.
- 58.2% of respondents disagreed with the statement that CBD can elicit a high, and 26.3% said they didn’t know if it could or not.
- Large populations within the respondent pool were not sure of whether or not CBD laws in their states (47.6%) and the country (46.2%) are well-designed.
- Only 23.1% of respondents agreed that they knew the difference between full-spectrum CBD, broad-spectrum CBD, and CBD isolate. Last year, only 20.4% of respondents were confident they knew the difference between the three.
- Furthermore, the vast majority of respondents said they were unsure if one extract was better than another.
- Just over two-thirds of respondents (68.7%) agreed that they are likely to read a review before purchasing a CBD product.
Part Two: CBD Consumer Profiles
Current CBD Consumers
All of the data in this section represent current consumers only, who made up 27.2% of the total pool of eligible respondents.
We will highlight data for each of the other groups (uninterested consumers, potential consumers, and past consumers) in the following sections.
As before, let’s start with a demographic breakdown of current CBD consumers.
Demographics
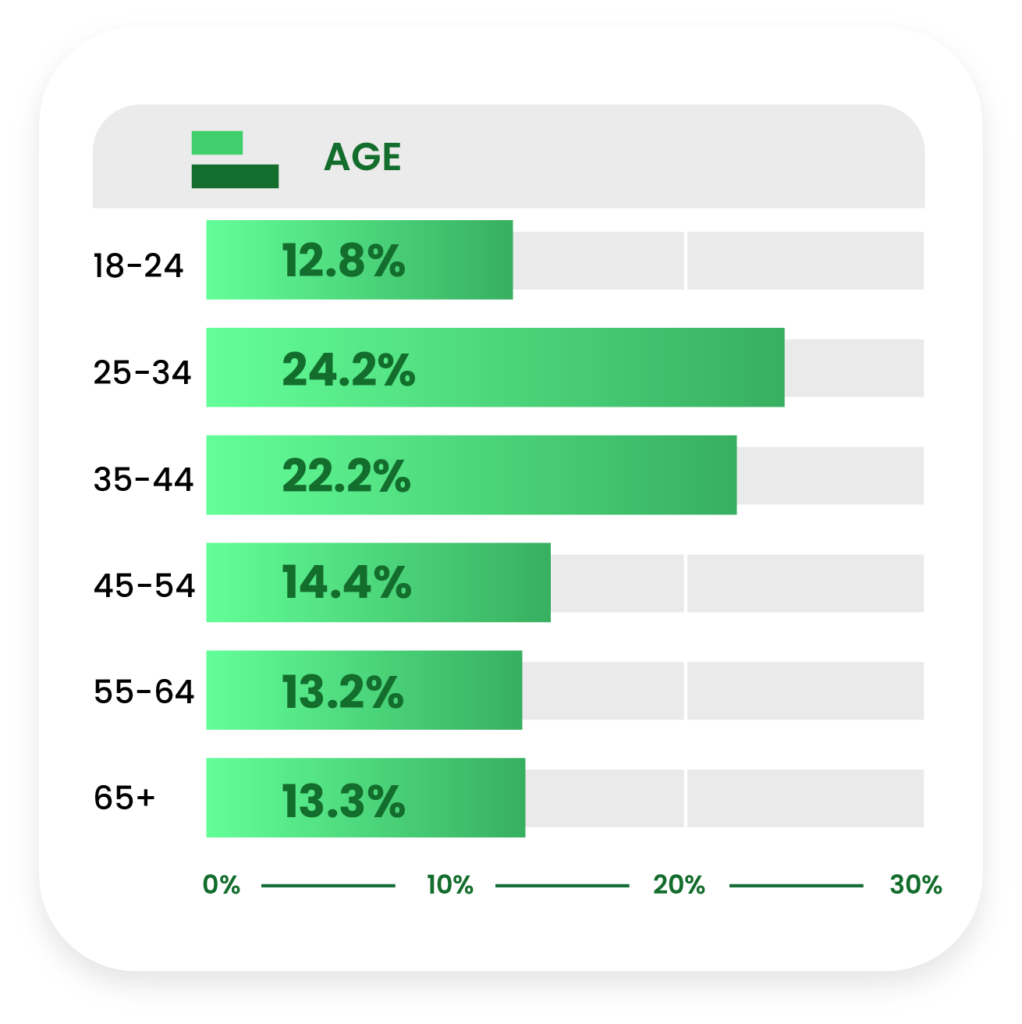
Two in five current consumers are 45 years of age or older (40.9%), which is much younger than the entire respondent pool.
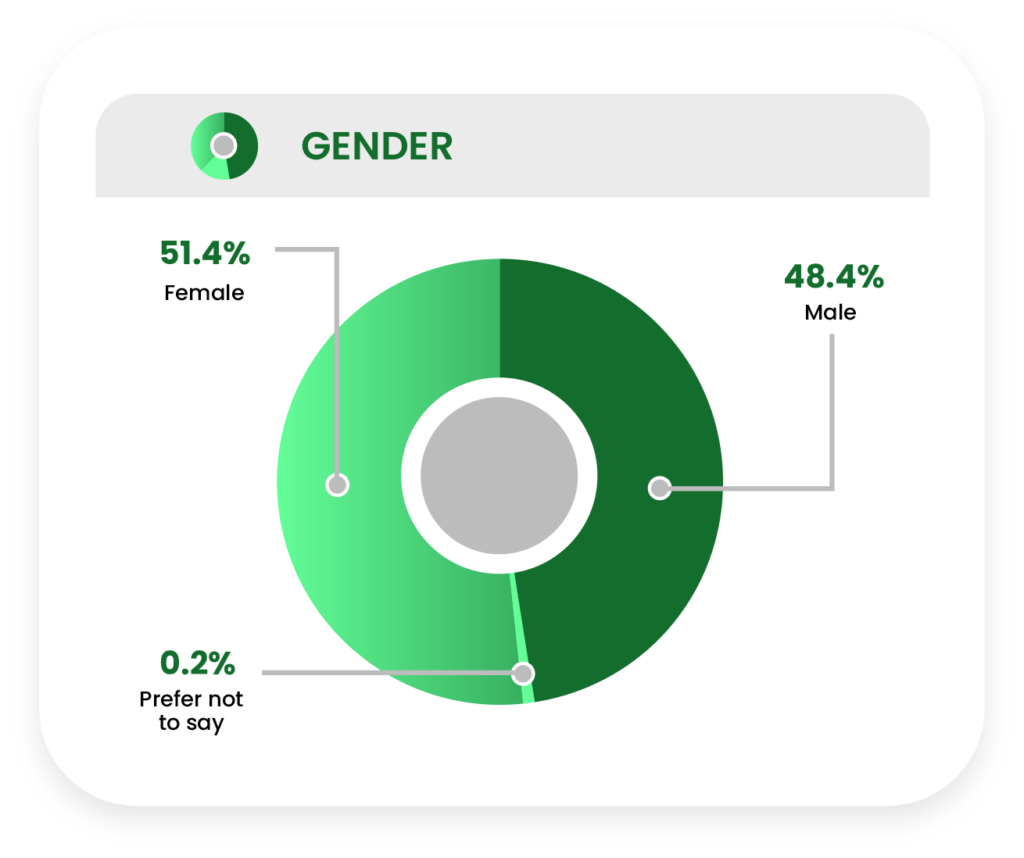
Current consumers skew slightly more female at 51.4% versus 48.4% male.
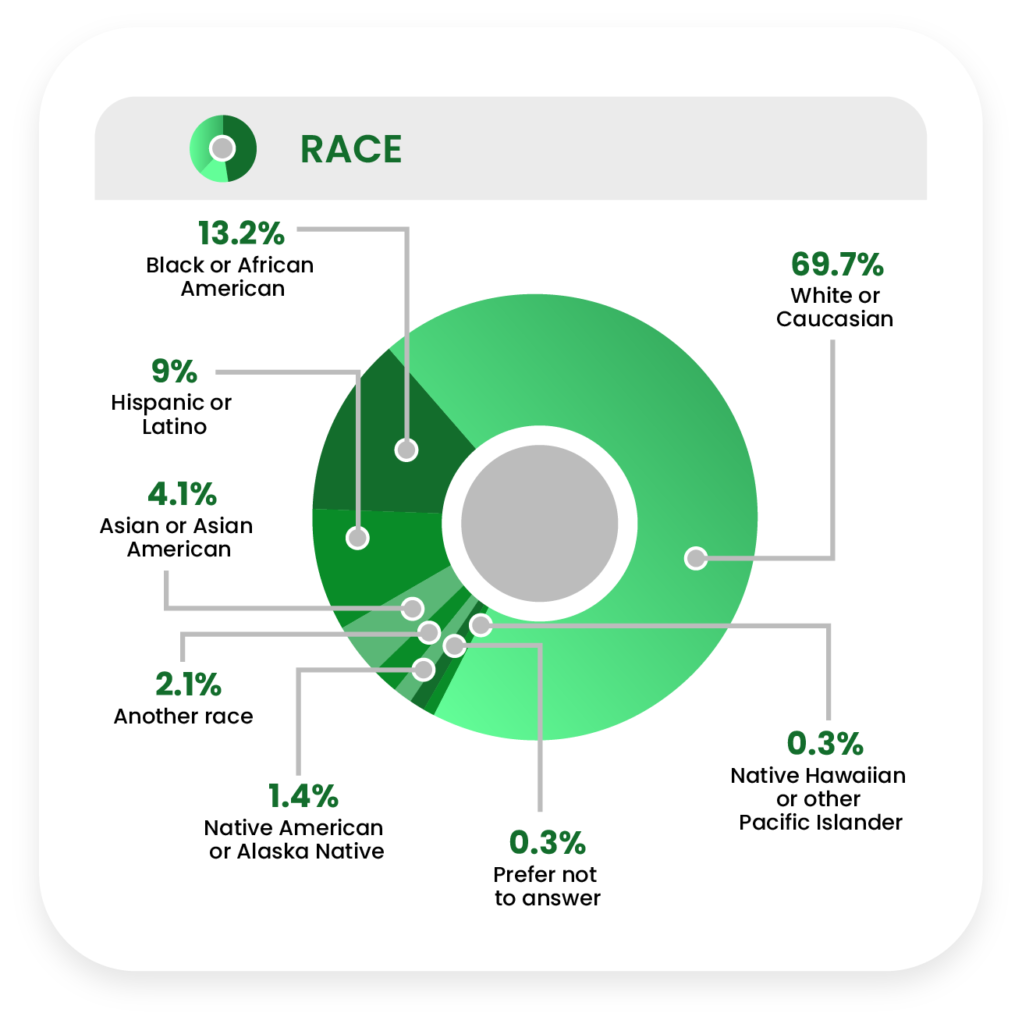
A little more than two-thirds of current consumers are White or Caucasian.
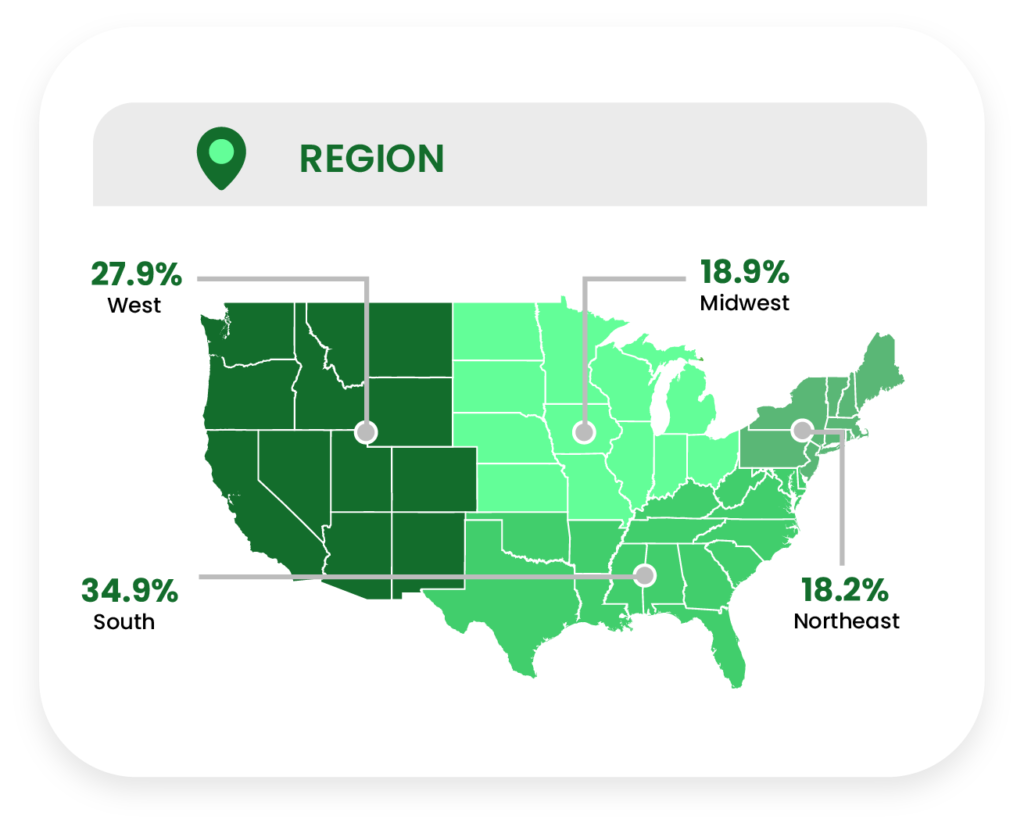
By region, 27.9% of respondents live in the West, 34.9% live in the South, 18.9% live in the Midwest, and 18.2% live in the Northeast.
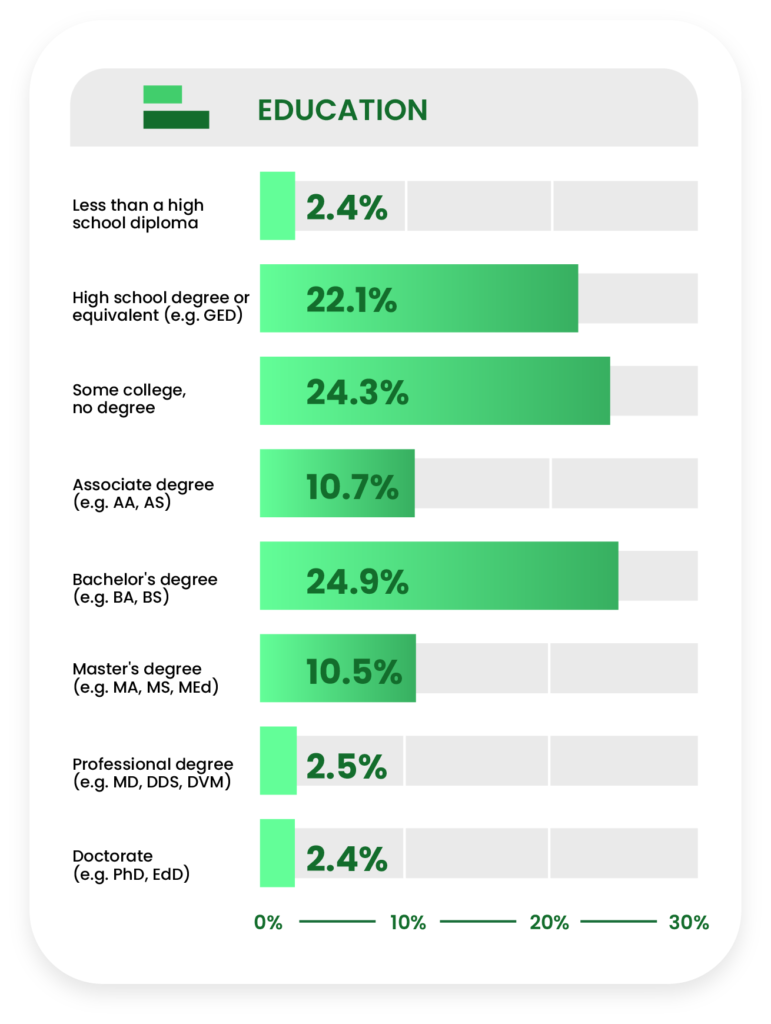
About half of current consumers (48.8%) do not have a college degree.
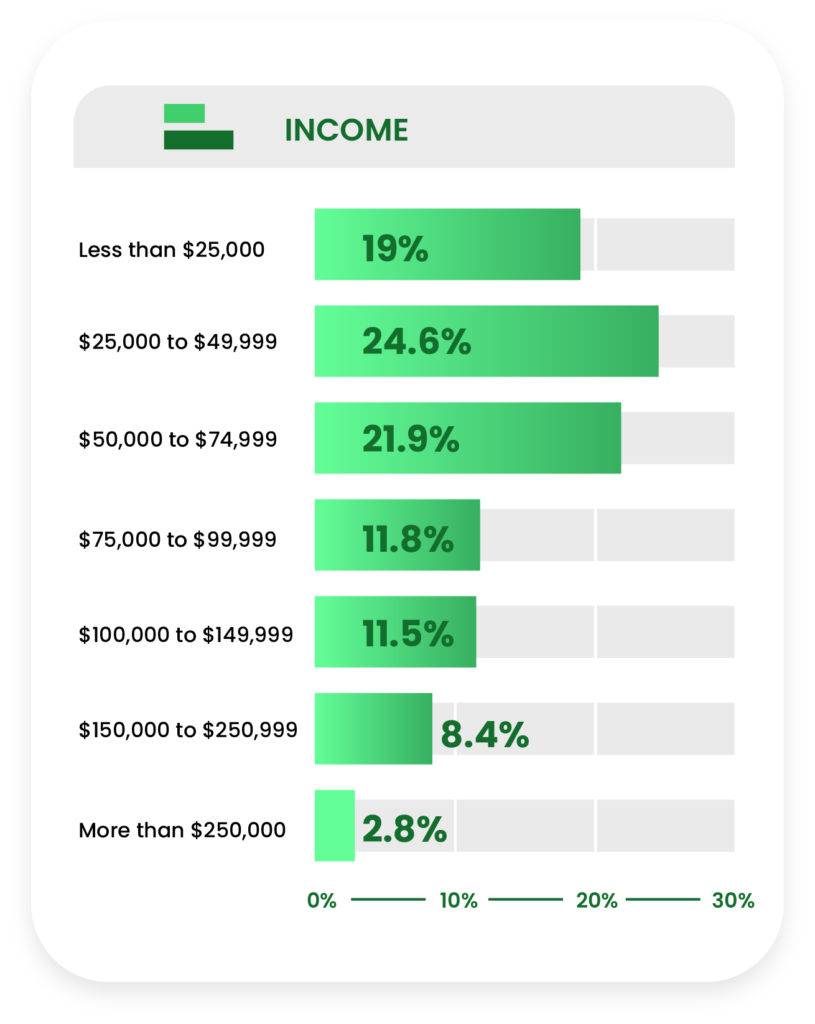
Nearly two-thirds of current consumers (65.5%) make less than $75,000 in household income annually.
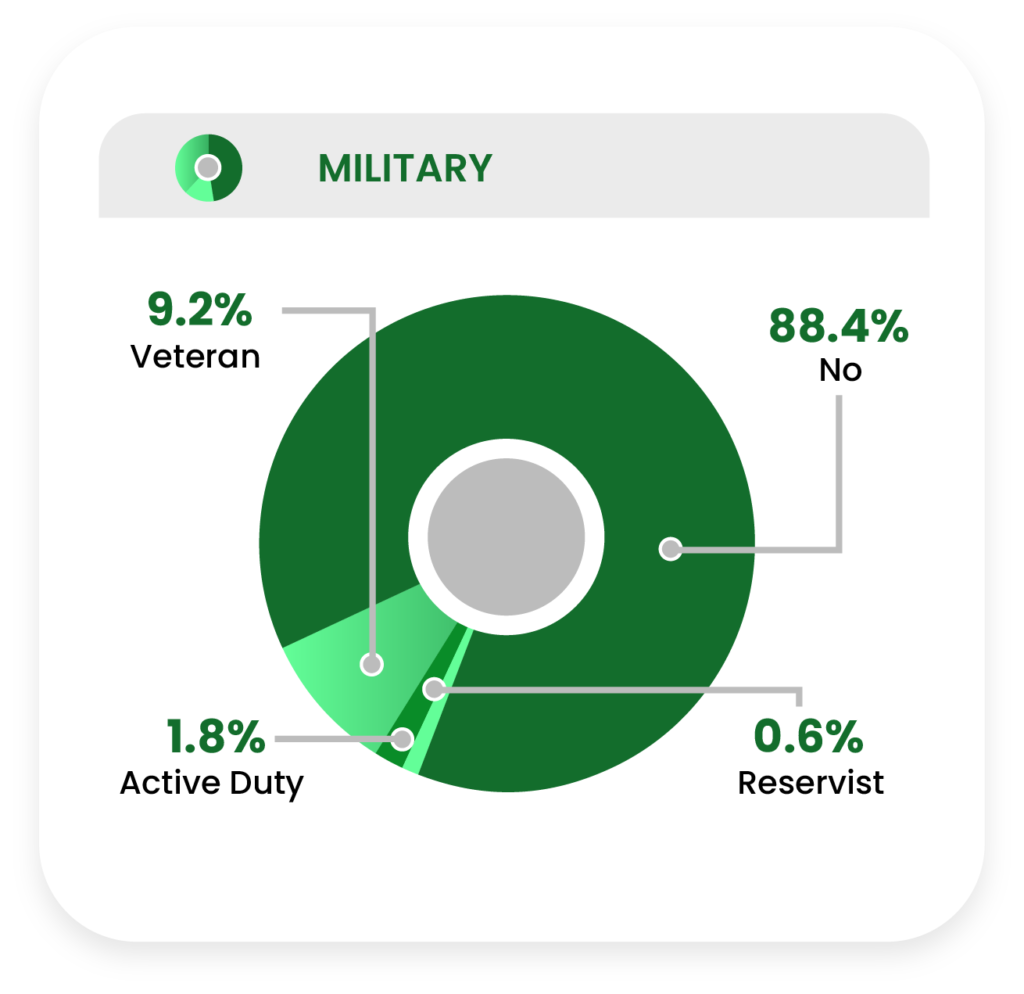
More than one in ten current consumers reported being affiliated with the military (11.6%): 1.8% are active duty military, 0.6% are retired, and 9.2% are veterans.
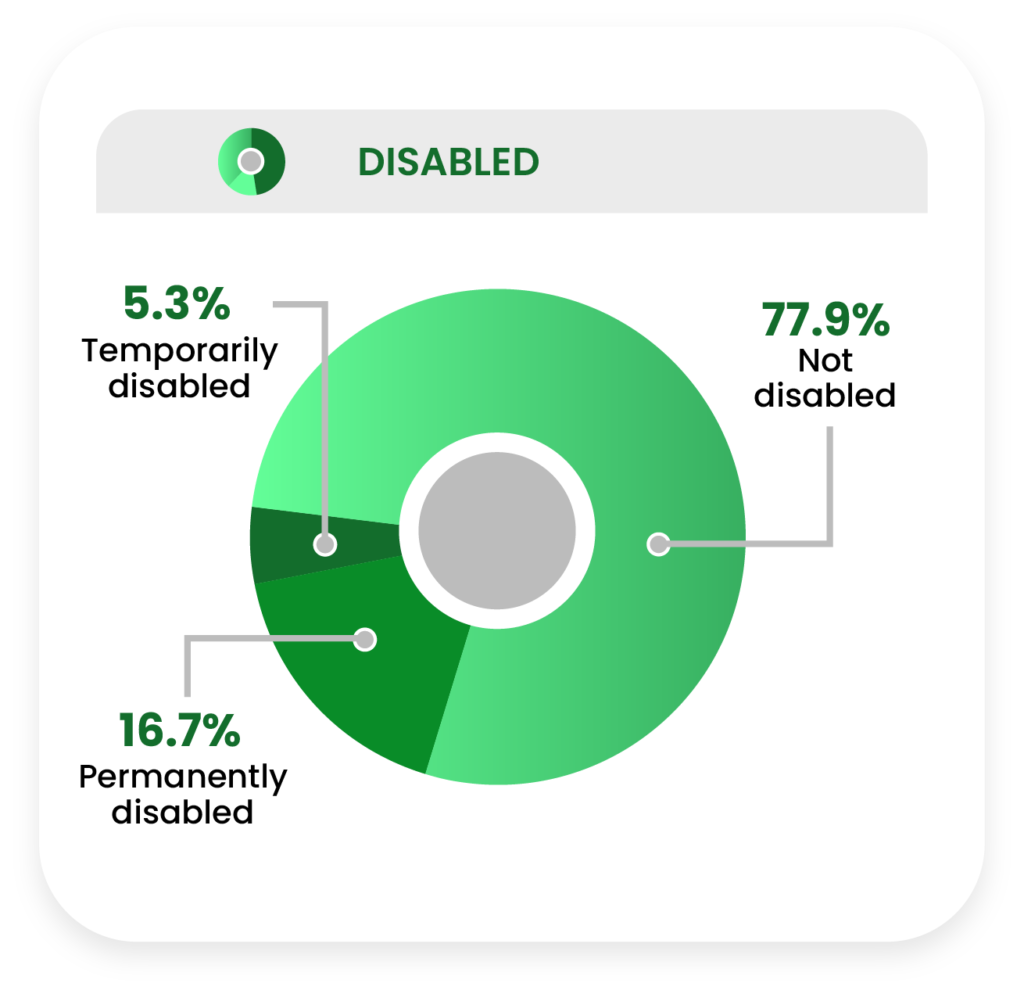
Just over one in five current consumers (22%) are disabled to some degree, as 5.3% and 16.7% are temporarily or permanently disabled, respectively.
Behavior
We surveyed current consumers about their habits and behavior surrounding their use of CBD, including when they first started taking CBD, how often they use it, and how much.
Current consumers also stated where they were most likely to purchase CBD, how open they are to buying from different CBD brands, and why they may switch brands.
Regarding their experience with CBD, we had respondents report whether they agreed or disagreed with certain statements.
Respondents also told us how much they typically spend on CBD per month and their expectations of what they will spend on CBD in the future.
Interestingly, we discovered trends in the data according to the age and region of residence of the current consumers surveyed.
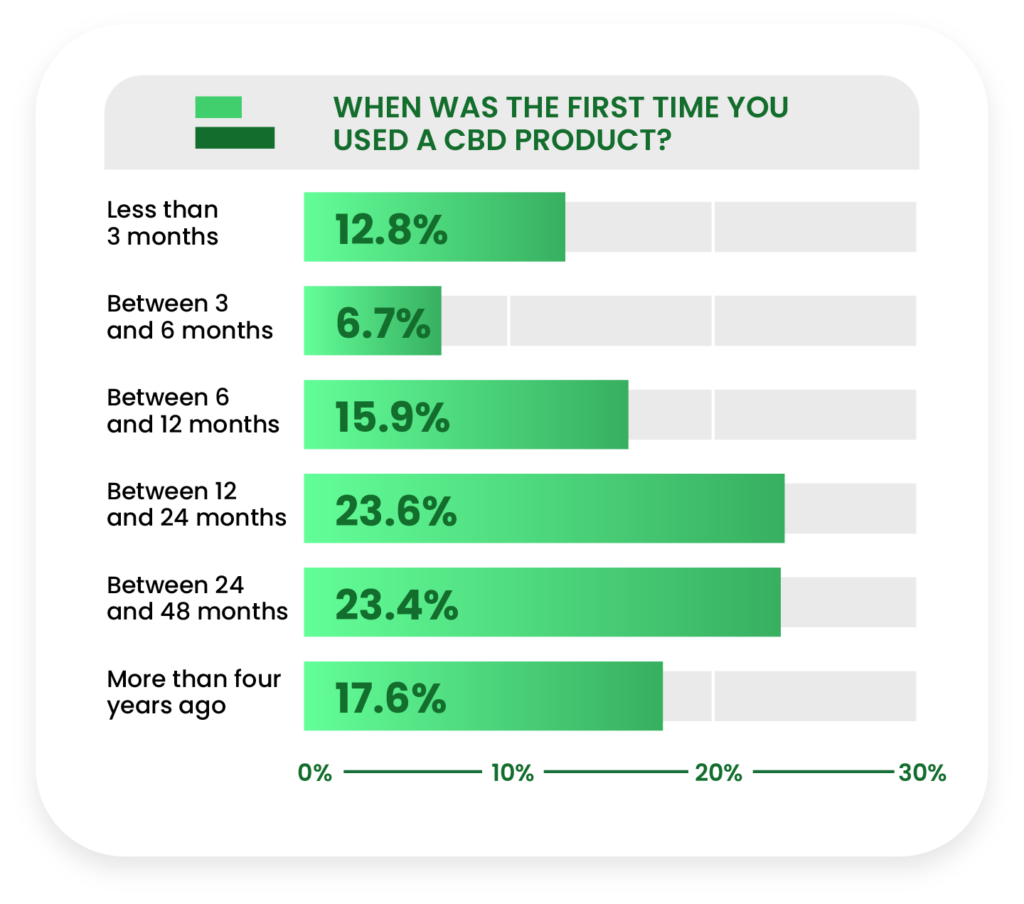
The majority of current consumers (64.6%) had first tried CBD at least 12 months prior to the date of the survey, compared to the 35.4% of consumers who tried it less than 12 months before the survey.
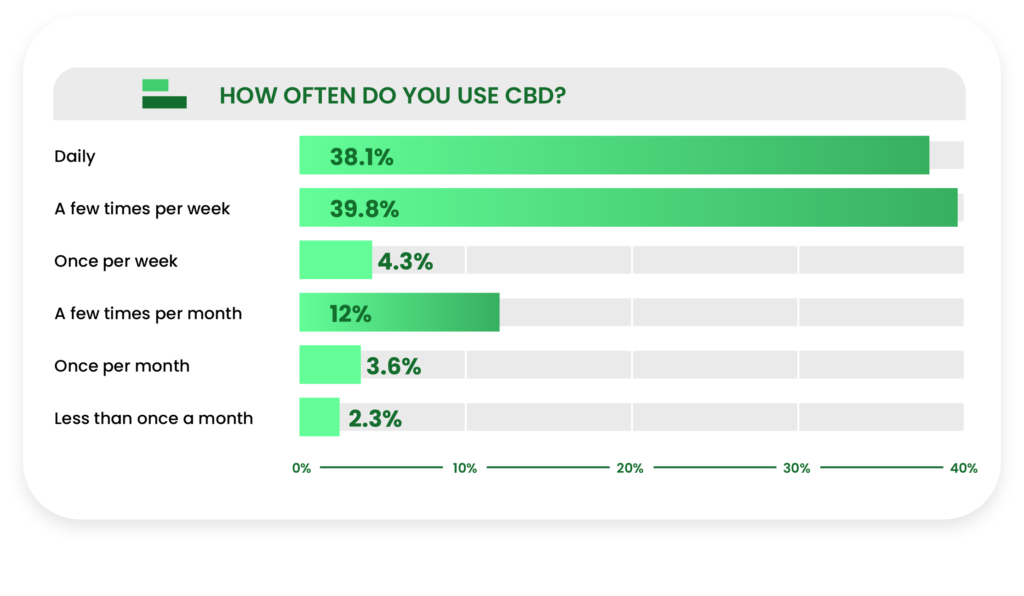
As it concerns frequency, 38.1% of current consumers take CBD daily and 39.8% said they take it a few times per week. Frequencies lower than a few times per week saw a very sharp dropoff (12% and lower).
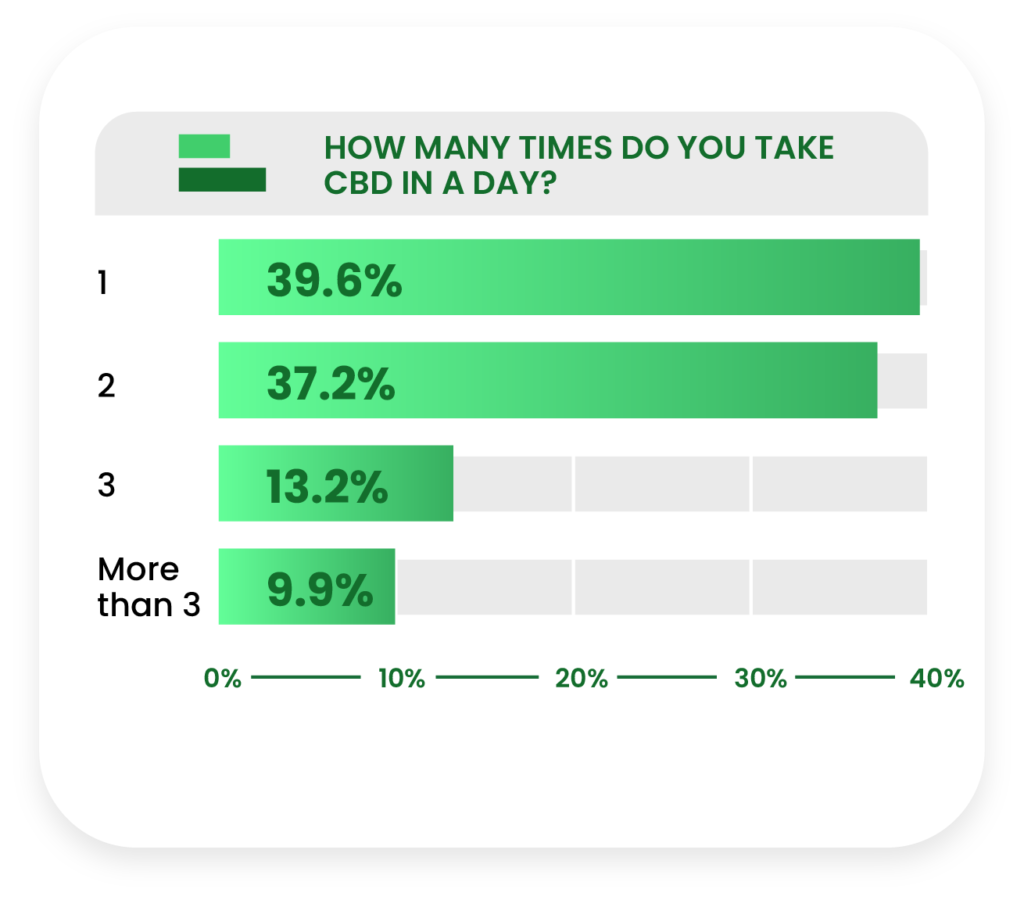
On days that respondents took CBD, the split between one and two doses was fairly close, at 39.6% and 37.2%, respectively.
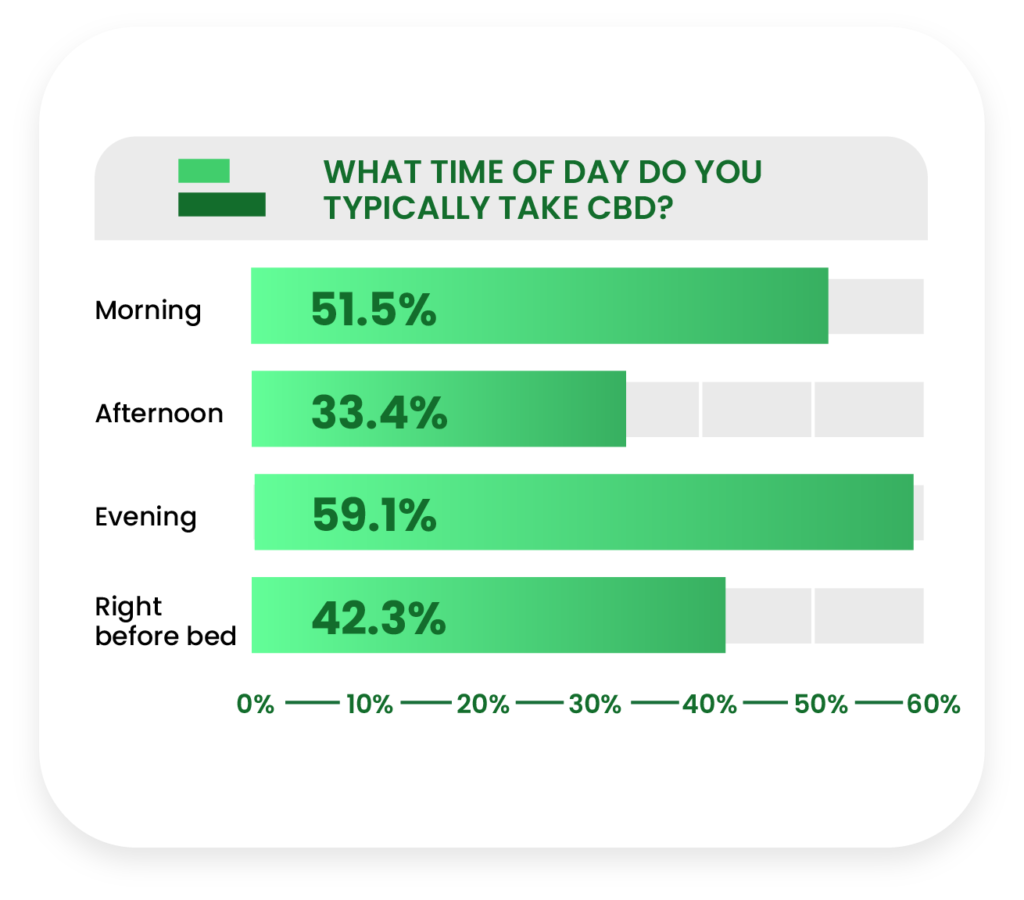
As CBD brands continue to expand their selections to include sleep formulations, the portion of people who take it in the evening (59.1%) outnumbers those who take it in the morning (51.5%).
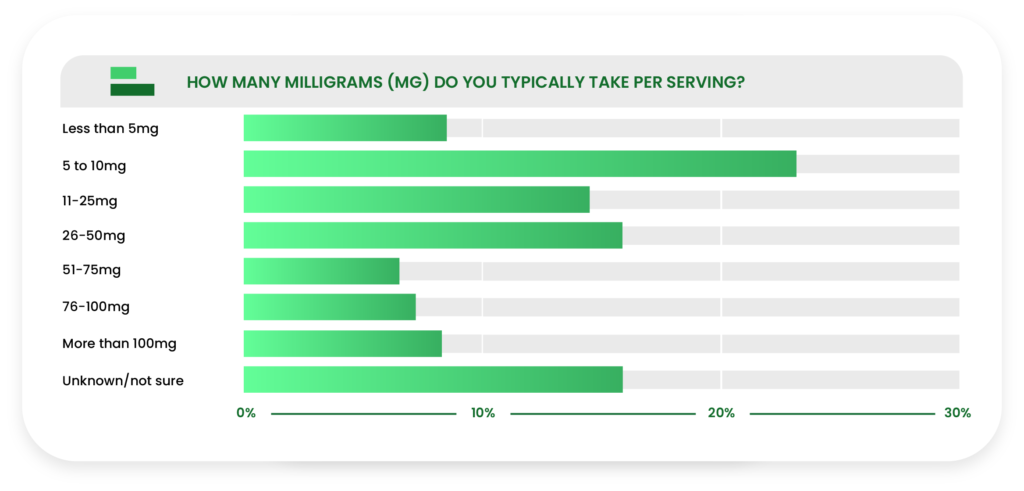
Regarding serving size, 5 to 10mg (milligrams) was the most popular response (23.2%), followed by 26-50mg (15.9%) and 11-25mg (14.5%).
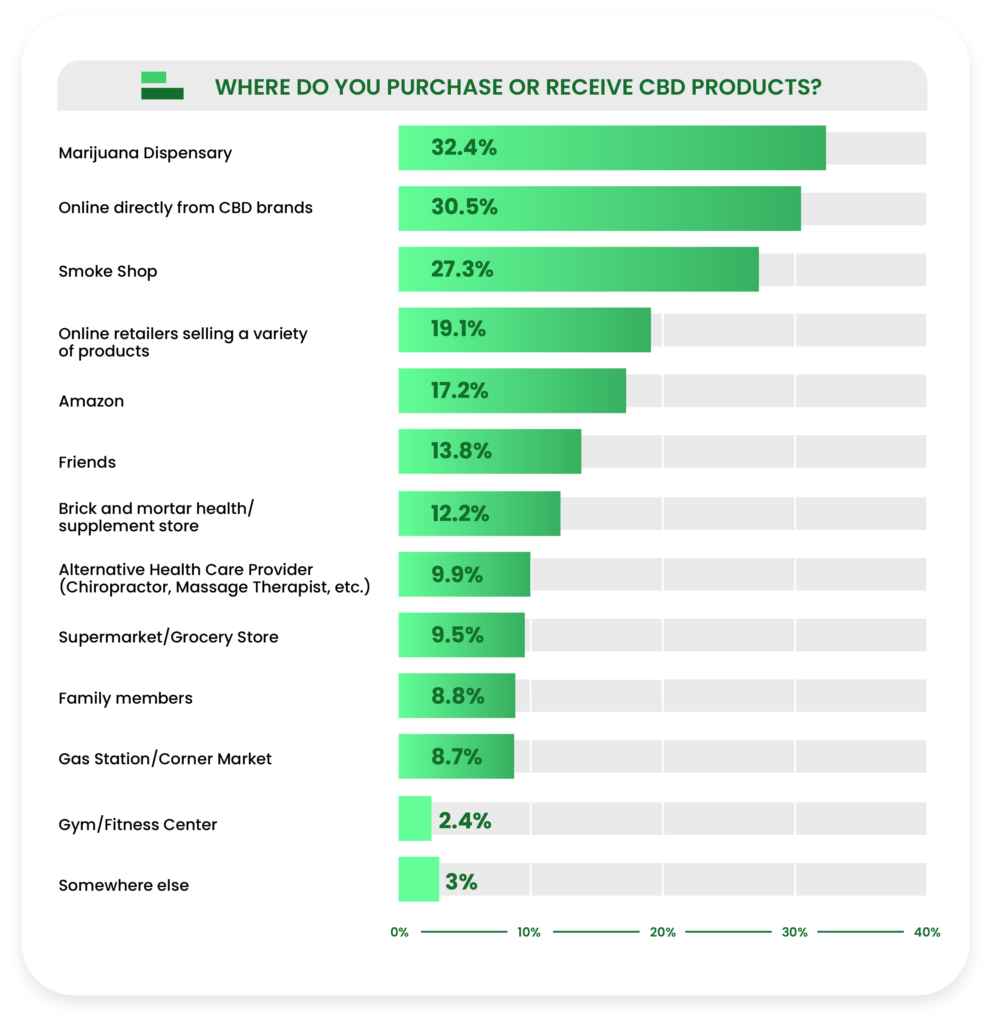
Thanks to a huge showing of support in the Western US especially, marijuana dispensaries took first for the most popular provider of CBD (32.4%), followed by direct online sales (30.5%) and smoke shops (27.3%).
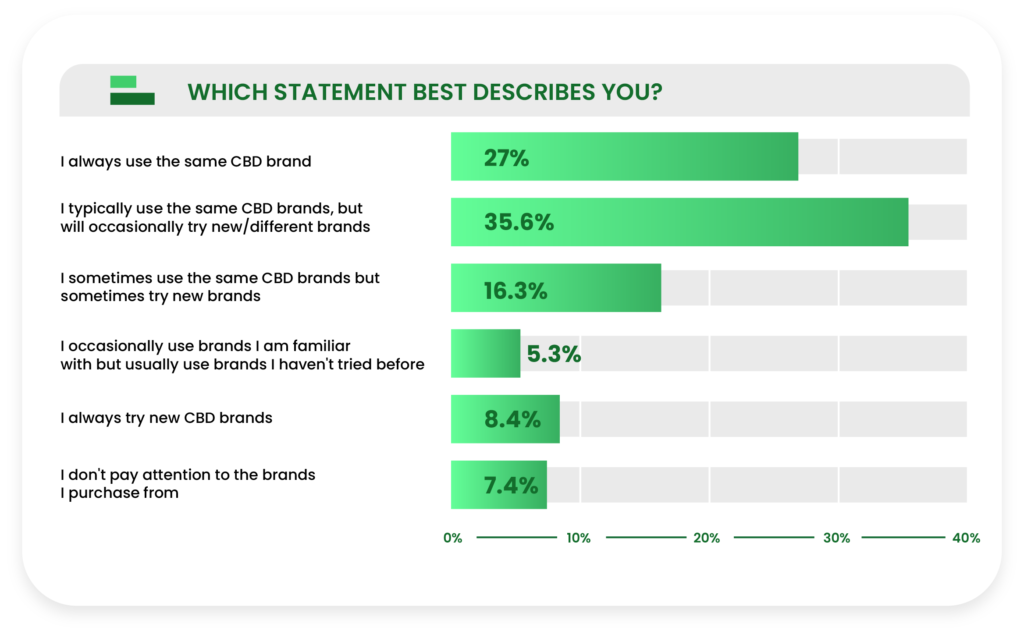
Brand loyalty is strong, but not completely rigid in the CBD space, as 35.6% of current consumers indicated that they occasionally sample brands other than their mainstay, compared to 27% who only stick with one brand.
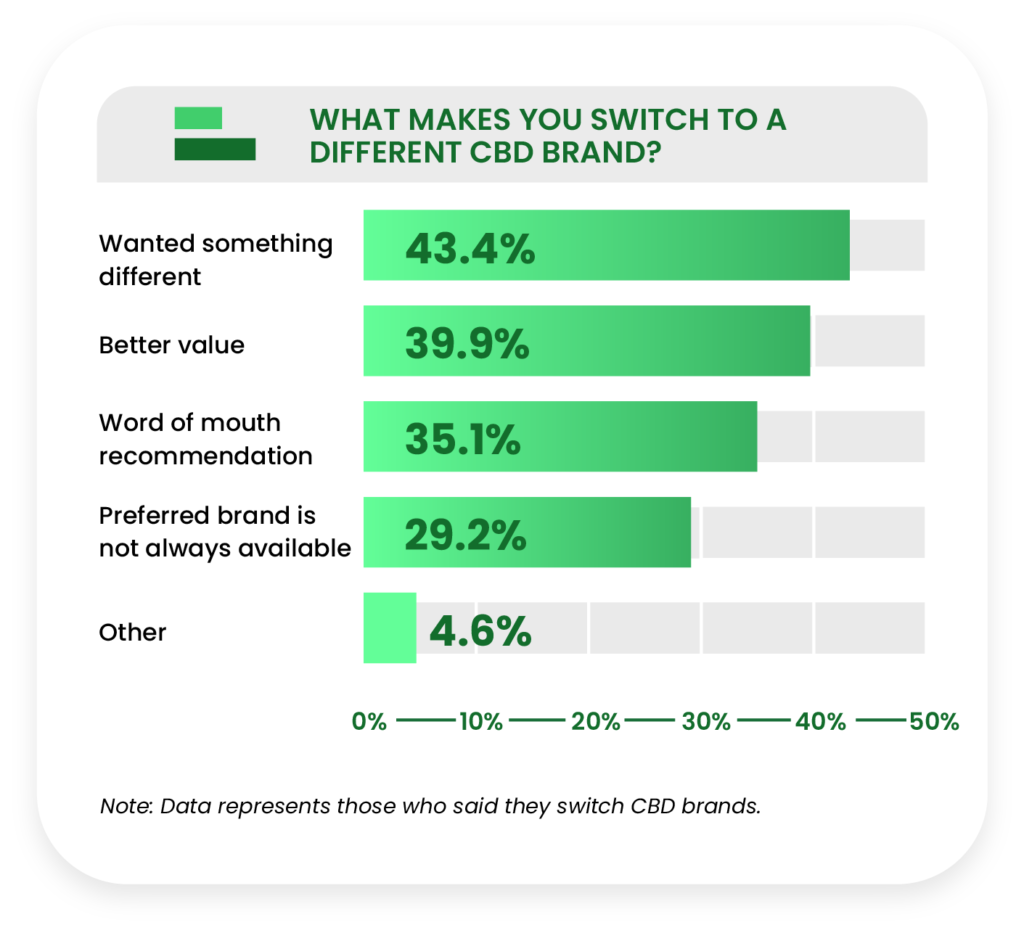
Among those who do sample different brands, the motives behind this behavior are split fairly evenly between wanting something different (43.4%), searching for a better value (39.9%), and following word-of-mouth recommendations (35.1%).
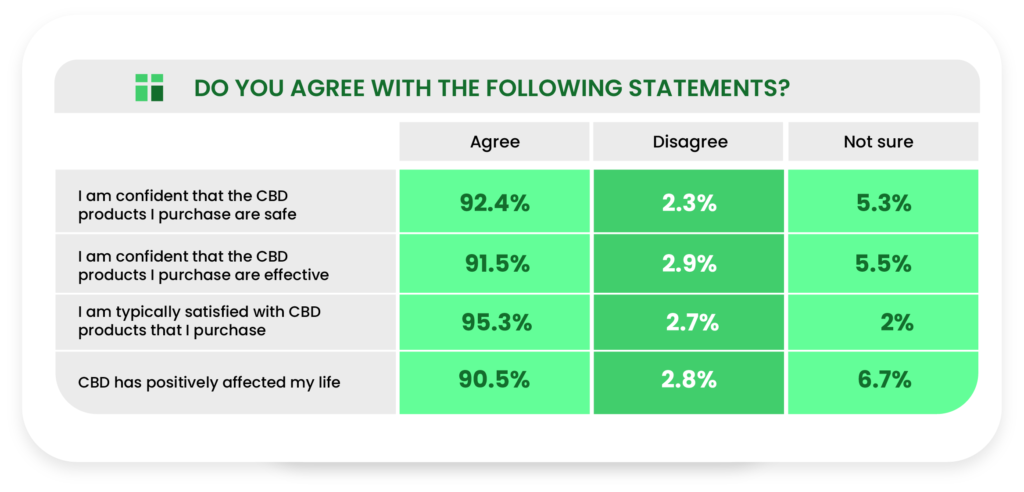
Despite regulation concerns, more than 90% of current users are confident that their CBD products are safe (92.4%) and effective (91.5%). Similarly, 95.3% of users are typically satisfied with their CBD products, and 90.5% agree that CBD has had a positive impact on their lives.
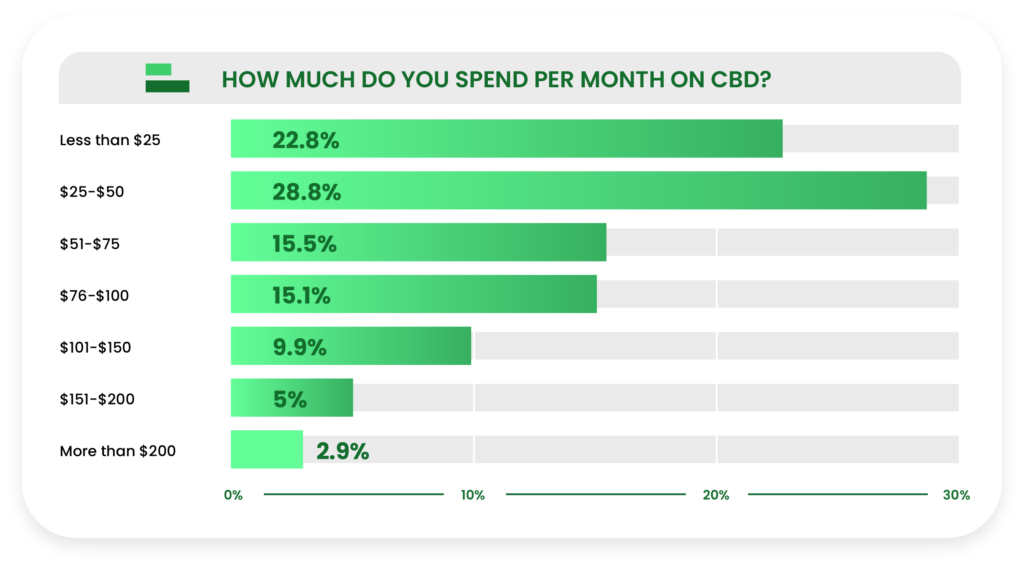
The greatest portion of current consumers (28.8%) spends between $25-50 on CBD per month, decreasing steadily from there as price increases.
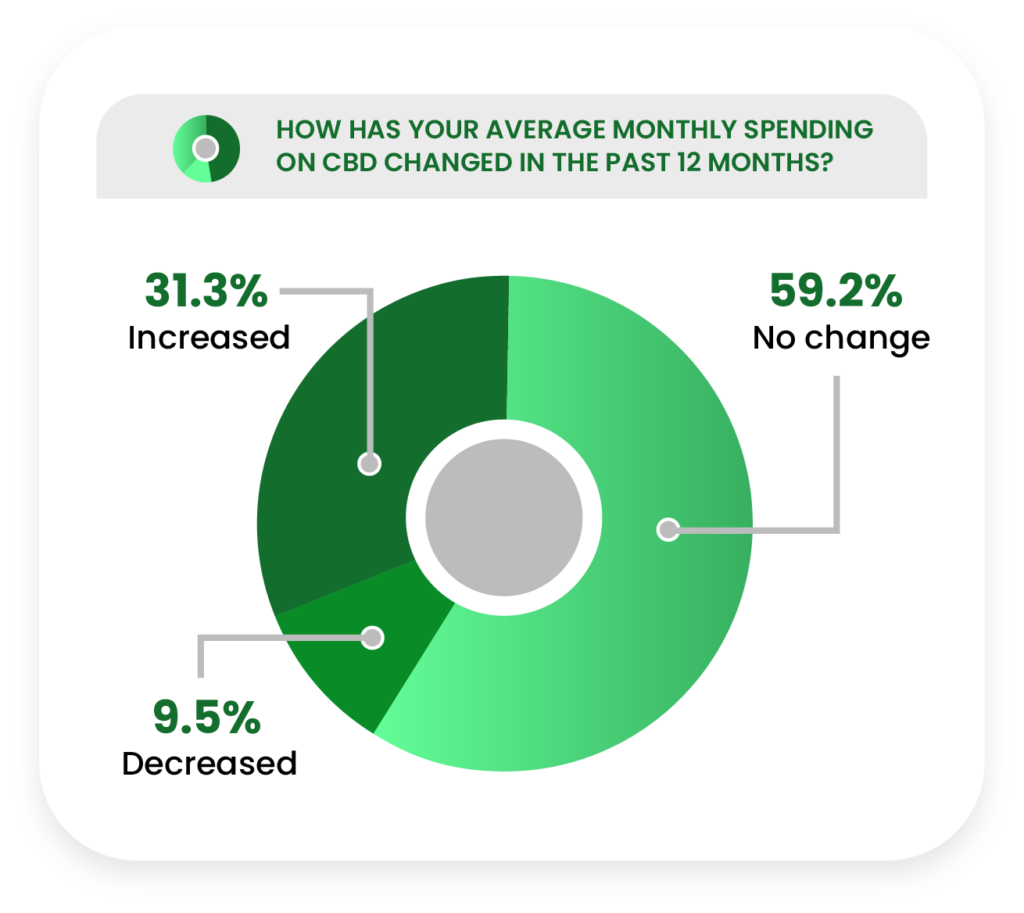
When asked if their CBD spending had increased, decreased, or stayed the same over the past year, 31.3% of current consumers reported an increase, 9.5% said a decrease, and 59.2% indicated no change.
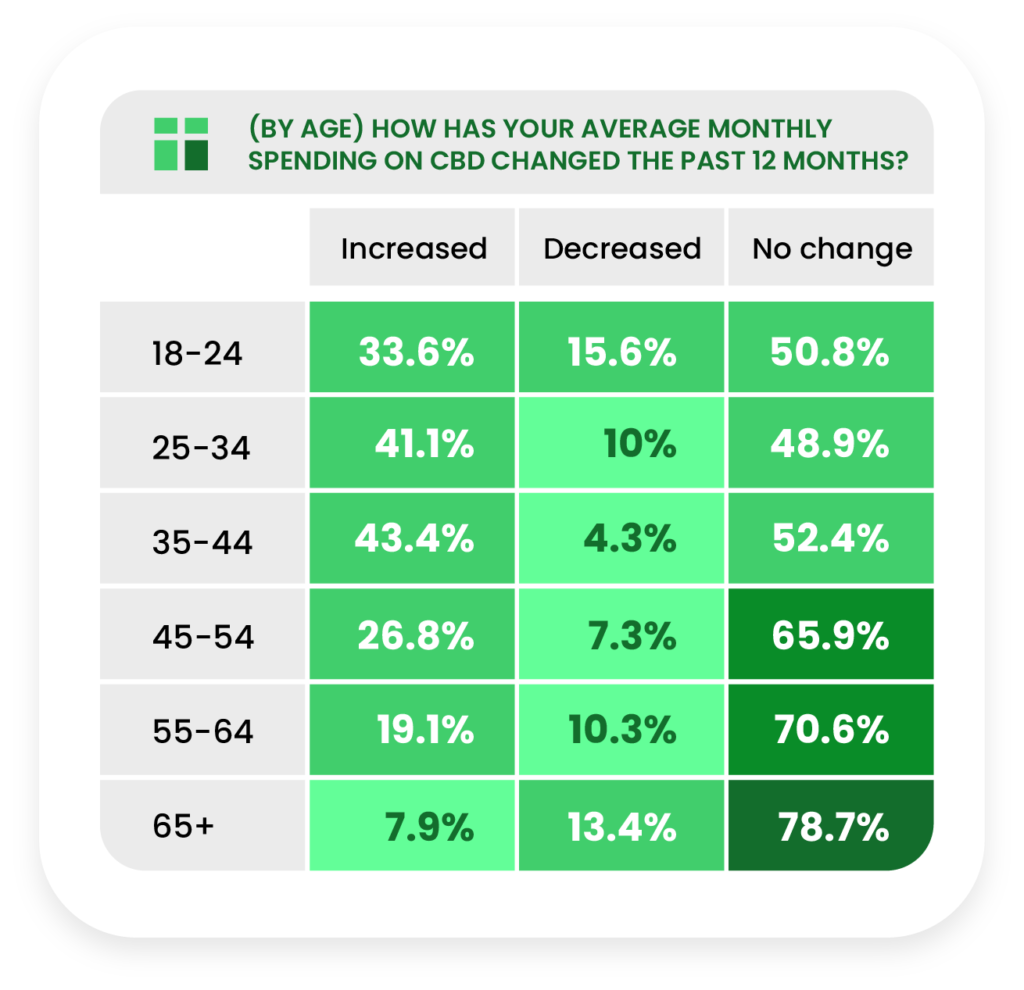
More consumers aged 65 or older stated that their spending had decreased (13.4%) versus increased (7.9%).
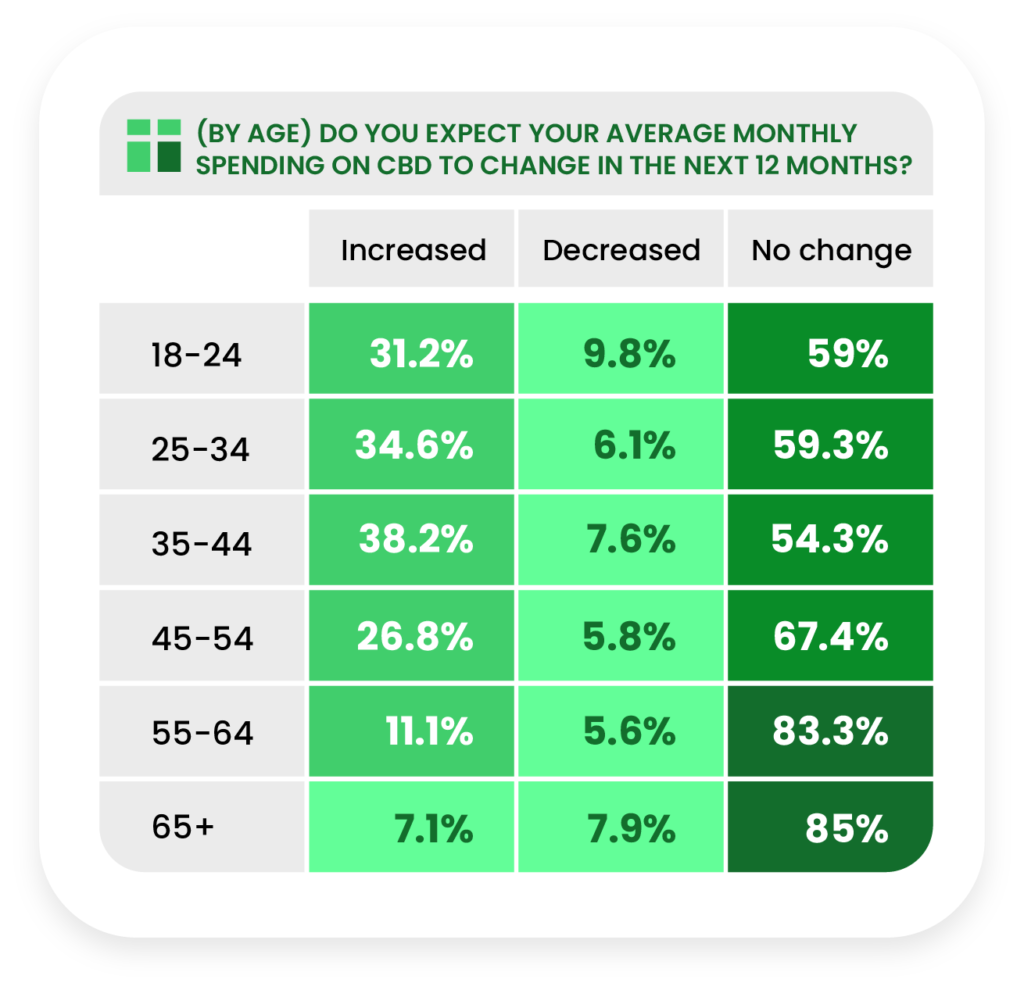
The same 65+ age group was the only one that was more likely to expect future spending to continue decreasing, though the trend was less extreme (7.9% said decrease versus 7.1% increase).
Product Preferences
While both current and past consumers were asked about their product preferences, we filtered the data by consumer status to find out how the two differed.
We found that current consumers have tried more products than past consumers and, perhaps as a result, are more split on their preferred product.
CBD oils/tinctures still reign as the most used and preferred product type.
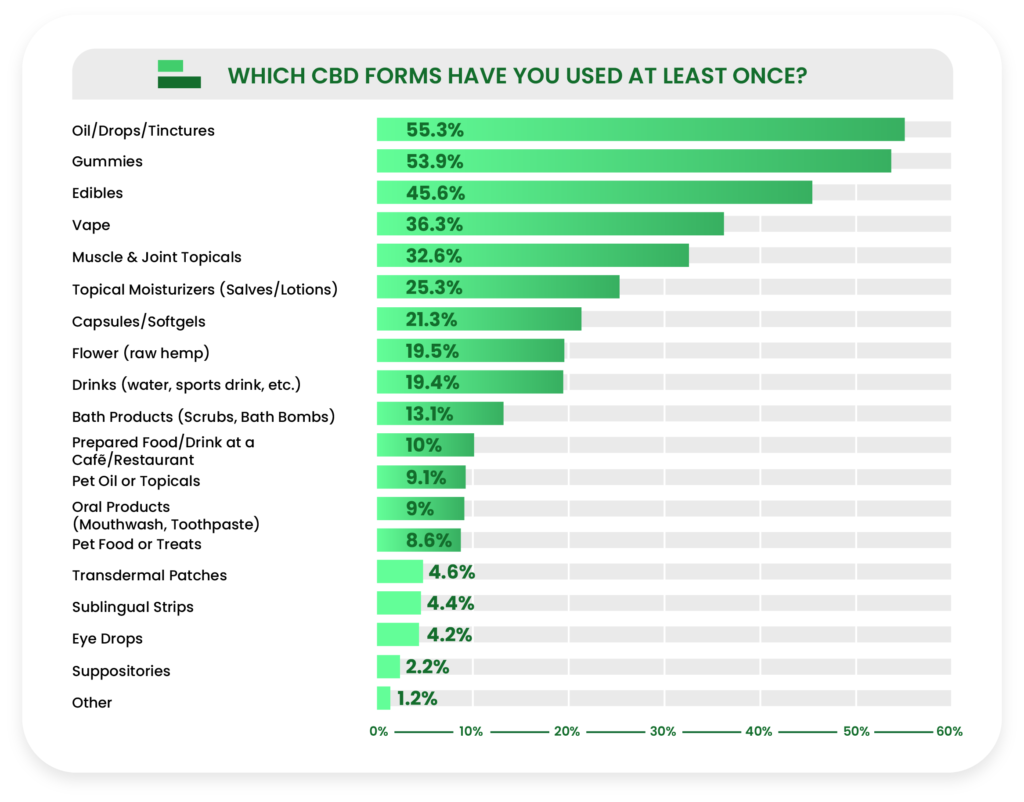
In our previous report, edibles (48.4%) had surpassed tinctures (42.9%) as the most commonly used product type, but tinctures surged ahead this year (55.3%), overcoming gummies (53.9%) and edibles (45.6%).
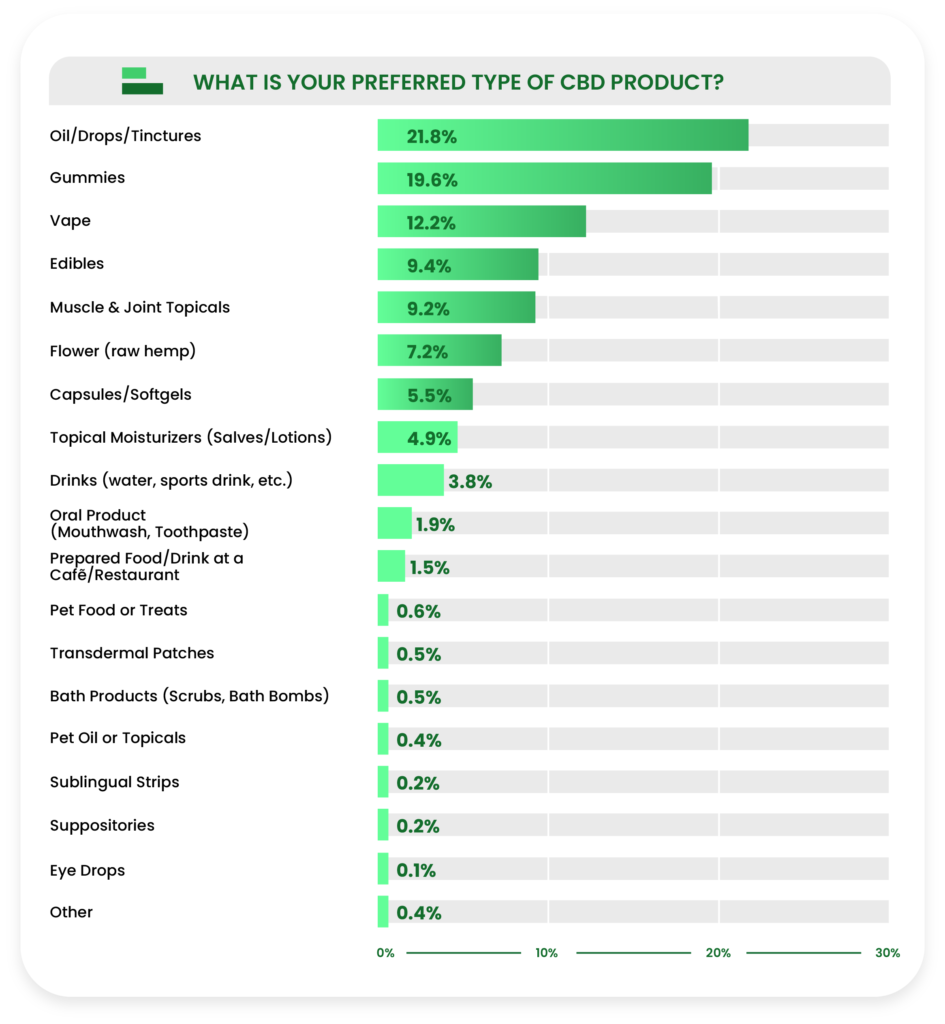
CBD oils/tinctures/drops (21.8%) and gummies (19.6%) held the line when it came to the most preferred types of CBD products, but edibles were nudged out of third place by vape (12.2%).
Reasons for Use and Perceived Effectiveness
Respondents were asked about the specific reasons they use CBD, as well as how effective they find CBD to be for such reasons.
We also found out how often current consumers supplement or replace a medication with CBD.
Interestingly, we found significant differences between men and women when it came to how they supplement medication with CBD.
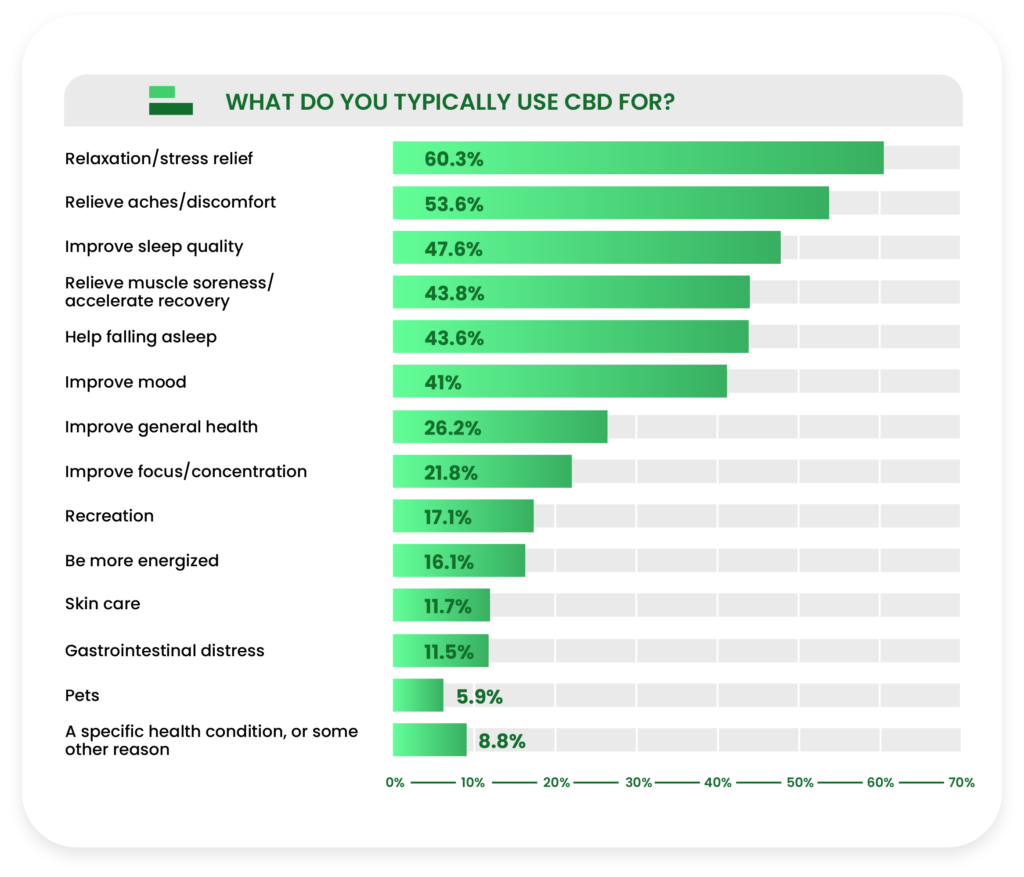
More than half of current CBD users surveyed said they use CBD for relaxation and stress relief (60.3%). Relieving aches (53.6%) came in second, and improving sleep quality (47.6%) came in third.
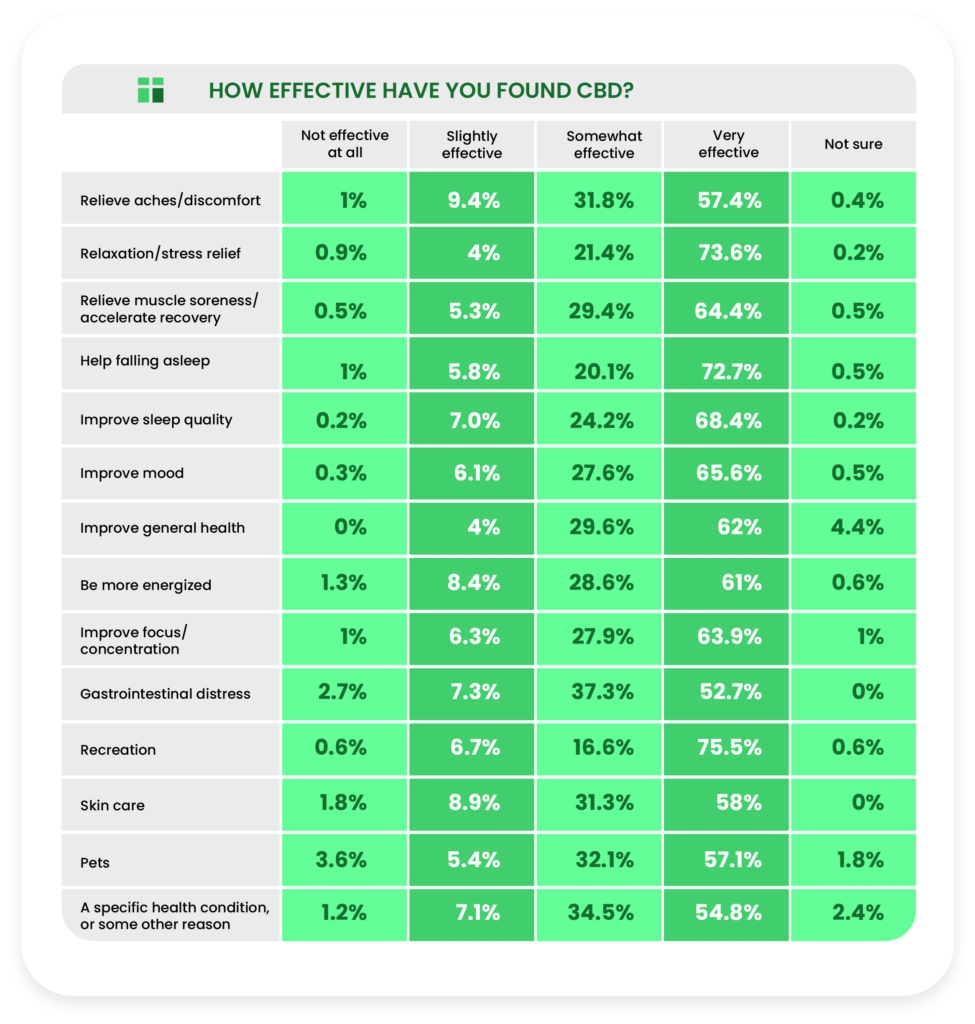
Nearly three in four current consumers found CBD to be very effective for relaxation (73.6%), but aches and discomfort (57.4%) was surpassed by several uses, including improving sleep quality (68.4%) and help falling asleep (72.7%).
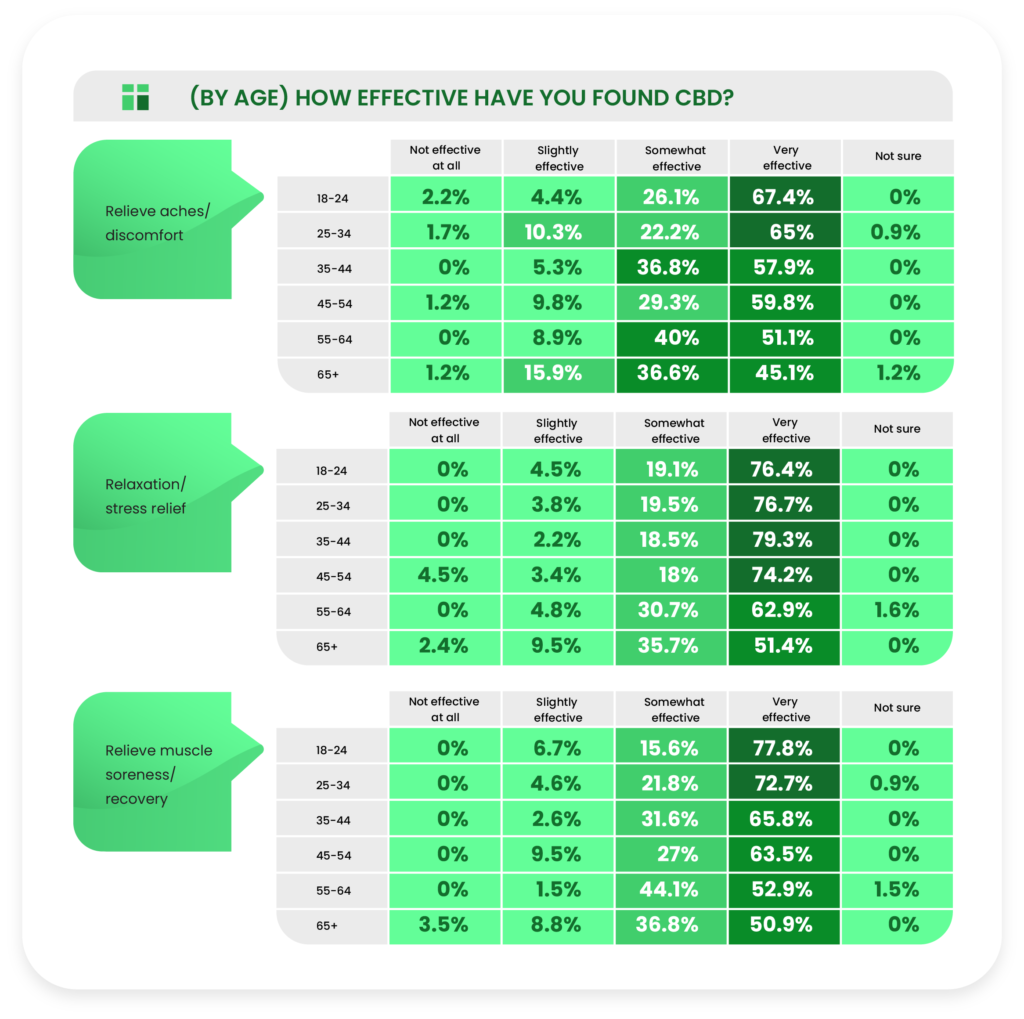
We noticed a fairly strong negative correlation between perceived effectiveness and age for relieve aches/discomfort (the “very effective” response drops from 67.4% in the youngest age group to 45.1% in the oldest group), relaxation and stress relief (76.4% to 52.4%), and relieve muscle soreness/recovery (77.8% to 50.9%).
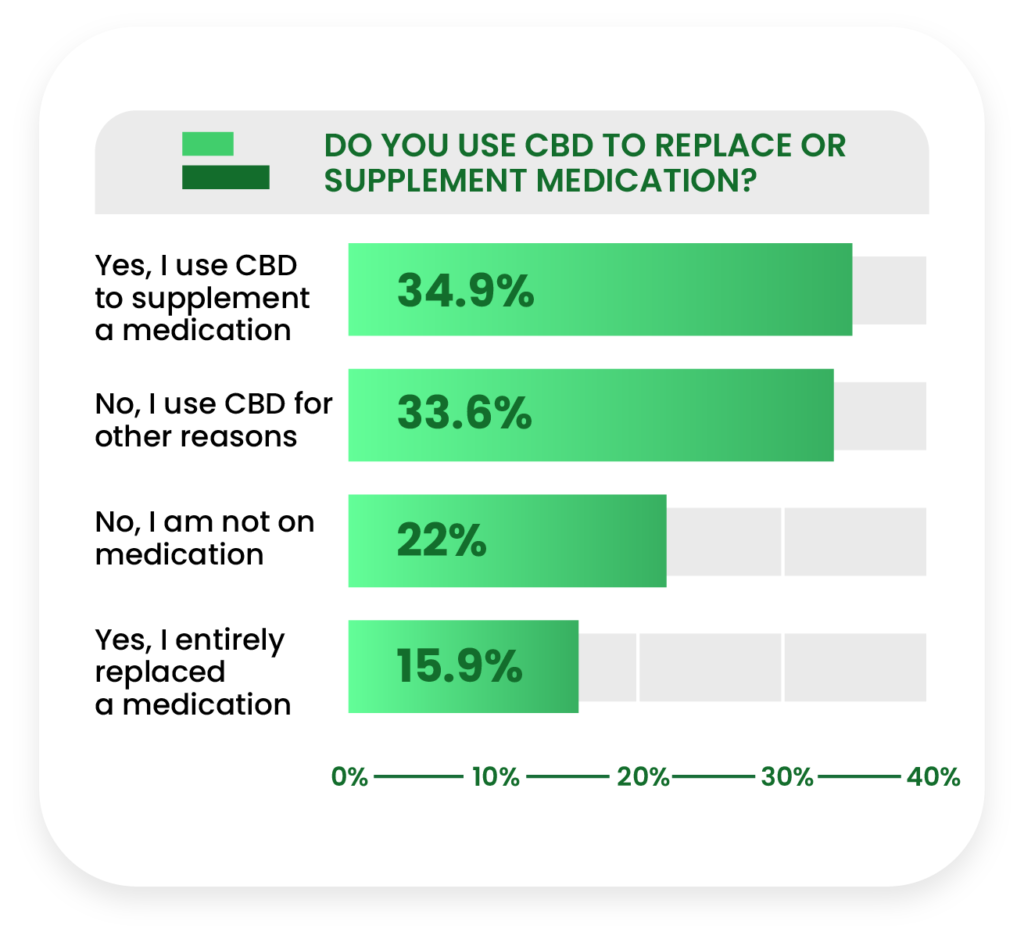
More than twice as many current consumers use CBD to supplement (34.9%) rather than completely replace (15.9%) a medication, and the rest (55.6%) are either not on medication or use CBD for other reasons.
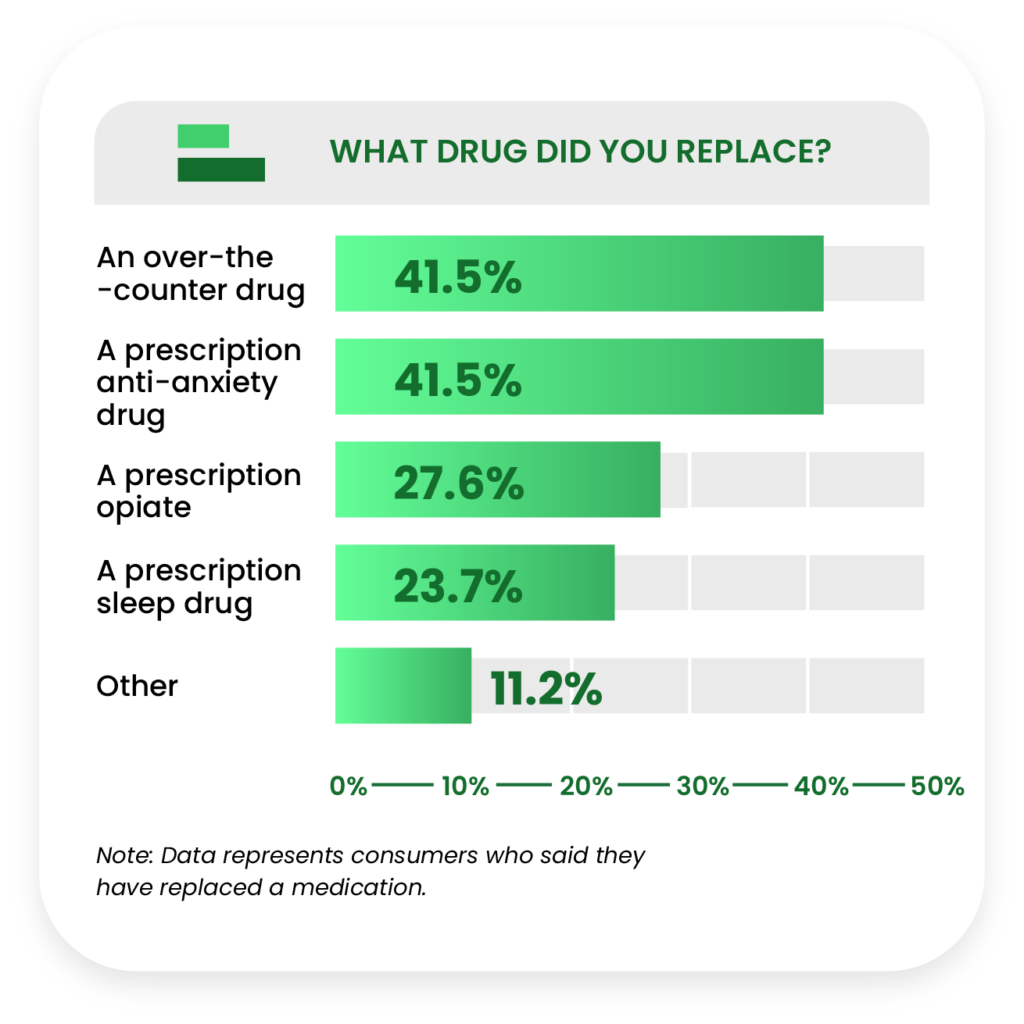
Among current consumers who did completely replace a medication with CBD, the type of medication replaced was an exact tie between over-the-counter drugs and prescription anxiety drugs (41.5%), with prescription opiates (27.6%) and sleep drugs (23.7%) trailing behind.
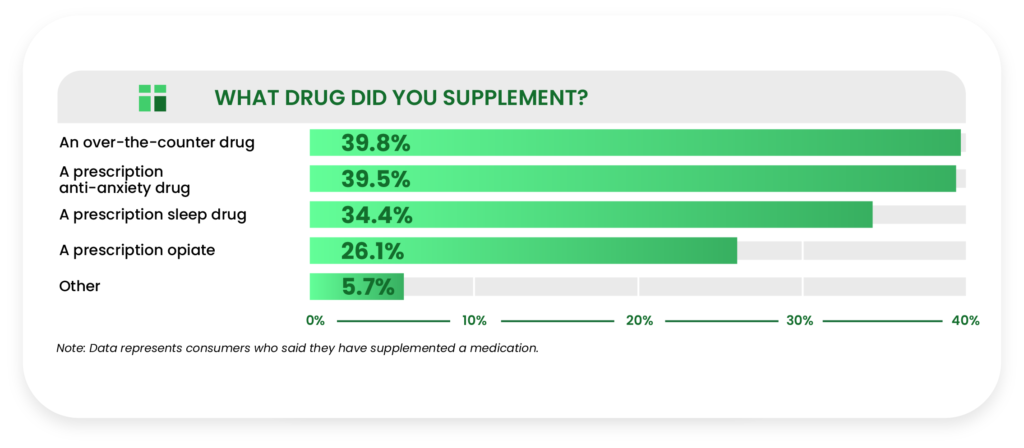
Over-the-counter drugs (39.8%) and prescription anti-anxiety medications (39.5%) also led the field for those who used CBD to supplement (as opposed to replacing) a medication.
Concerns About CBD
We asked respondents about their potential concerns with CBD, including if they believed they developed a tolerance toward CBD and if they experienced any side
effects.
Current consumers displayed a significant difference in developing a tolerance for CBD when analyzed by age.
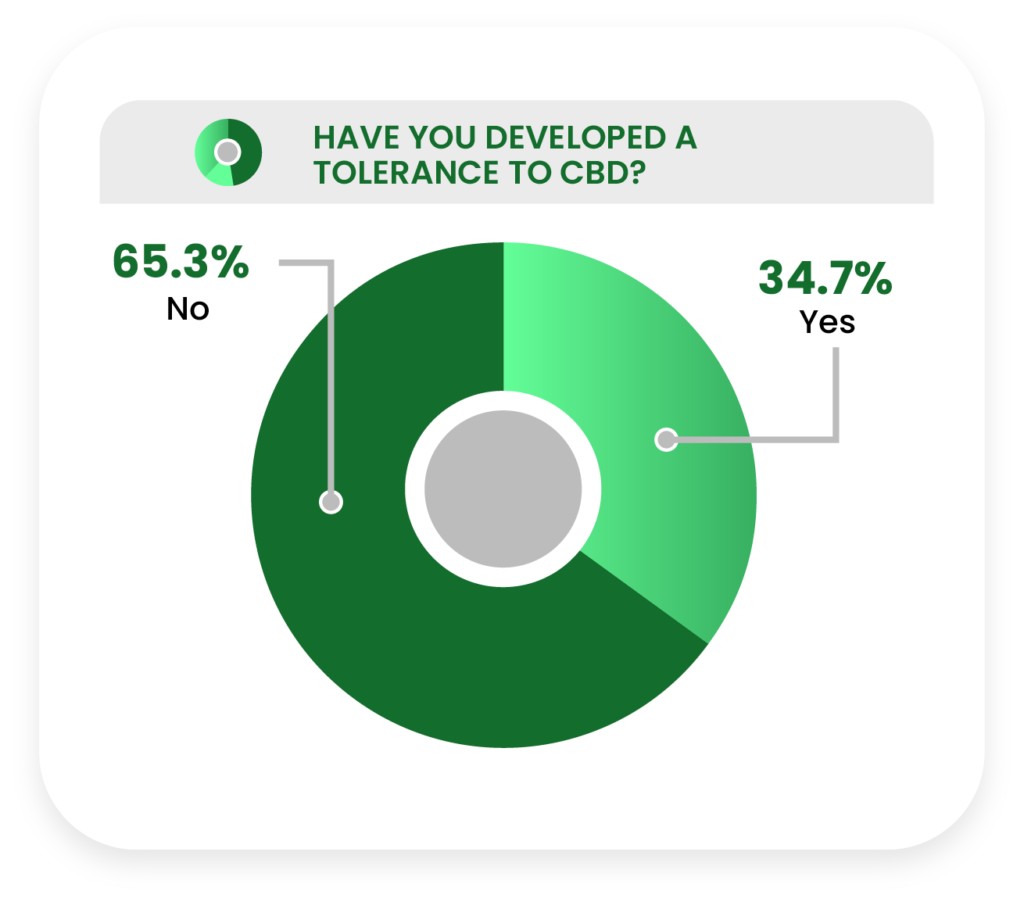
Almost two thirds of current users (65.3%) expressed that they did not develop a tolerance to CBD that required them to gradually increase serving sizes.
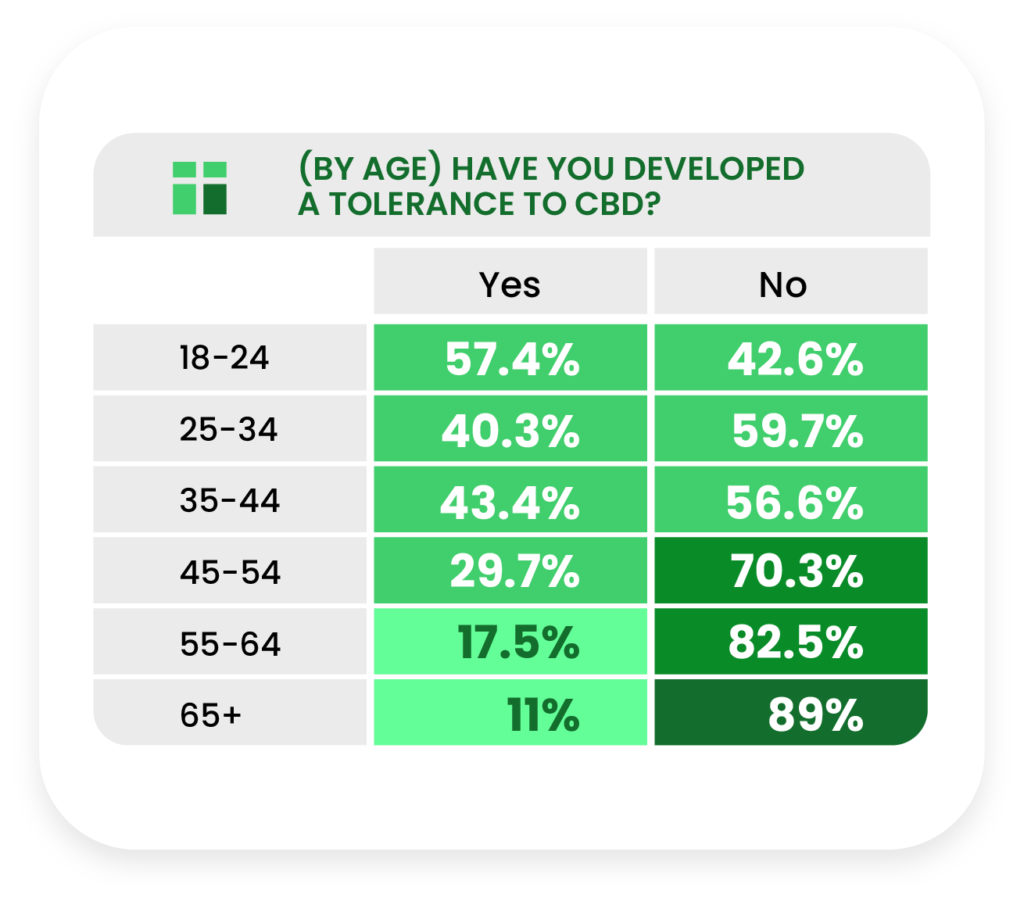
We encountered a negative correlation with age among respondents reporting a tolerance to CBD, plummeting steadily from 57.4% in those 18-24 to 11% in the 65+ age group.
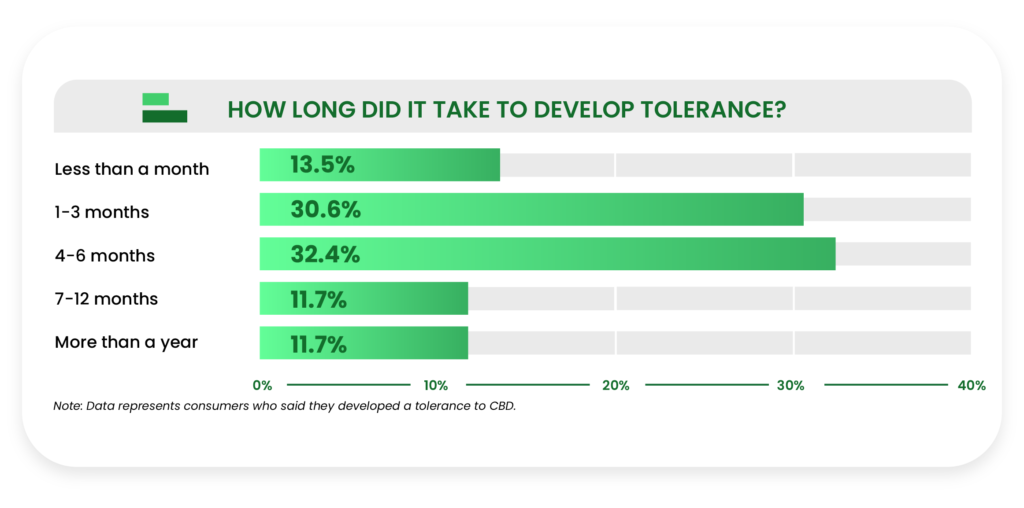
The majority of those who did have a tolerance said it took between 1-3 months (30.6%) or 4-6 months (32.4%) to develop.
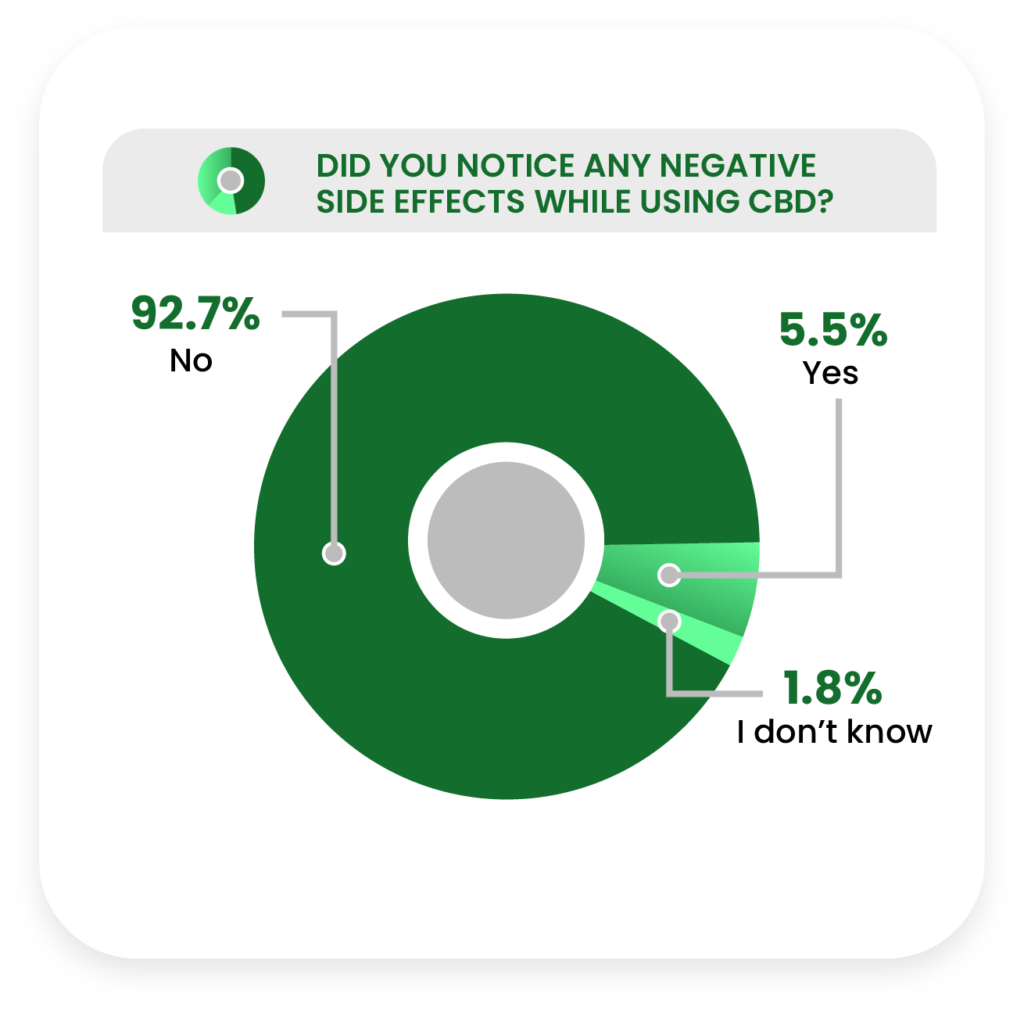
An overwhelming majority of current users stated they did not have any side effects (92.7%) resulting from CBD use.
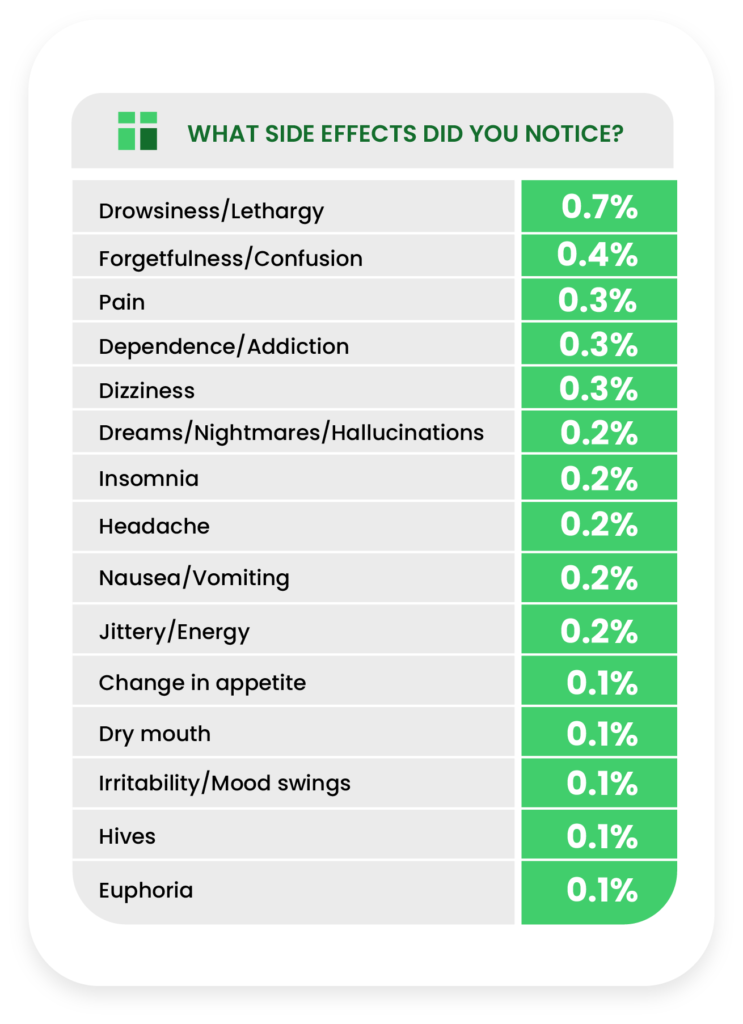
For those who did notice side effects, the most common side effects reported were drowsiness or lethargy (0.7%) and forgetfulness or confusion (0.4%).
The vast majority of these self-reported side effects are minor, and fewer respondents reported experiencing side effects this year than our previous report.
Past Consumers
All of the data in this section relate to the subset of respondents who had used CBD in the past, but no longer take it for whatever reason.
This group of past CBD consumers accounts for 21.6% of all eligible respondents, which is fewer than current (past consumers make up 44.3% of people who have tried CBD in the US).
First, a look at the basic demographics.
Demographics
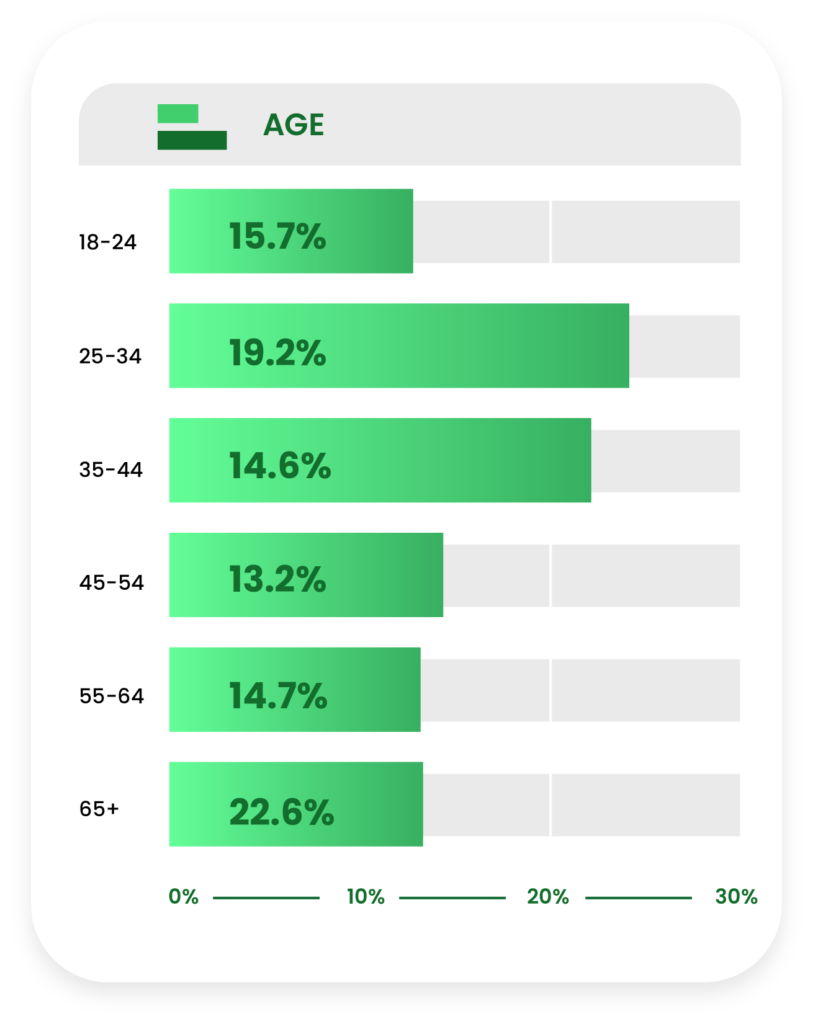
Half of past consumers are 45 years of age or older (50.5%), but skewing slightly less than the total eligible respondents.
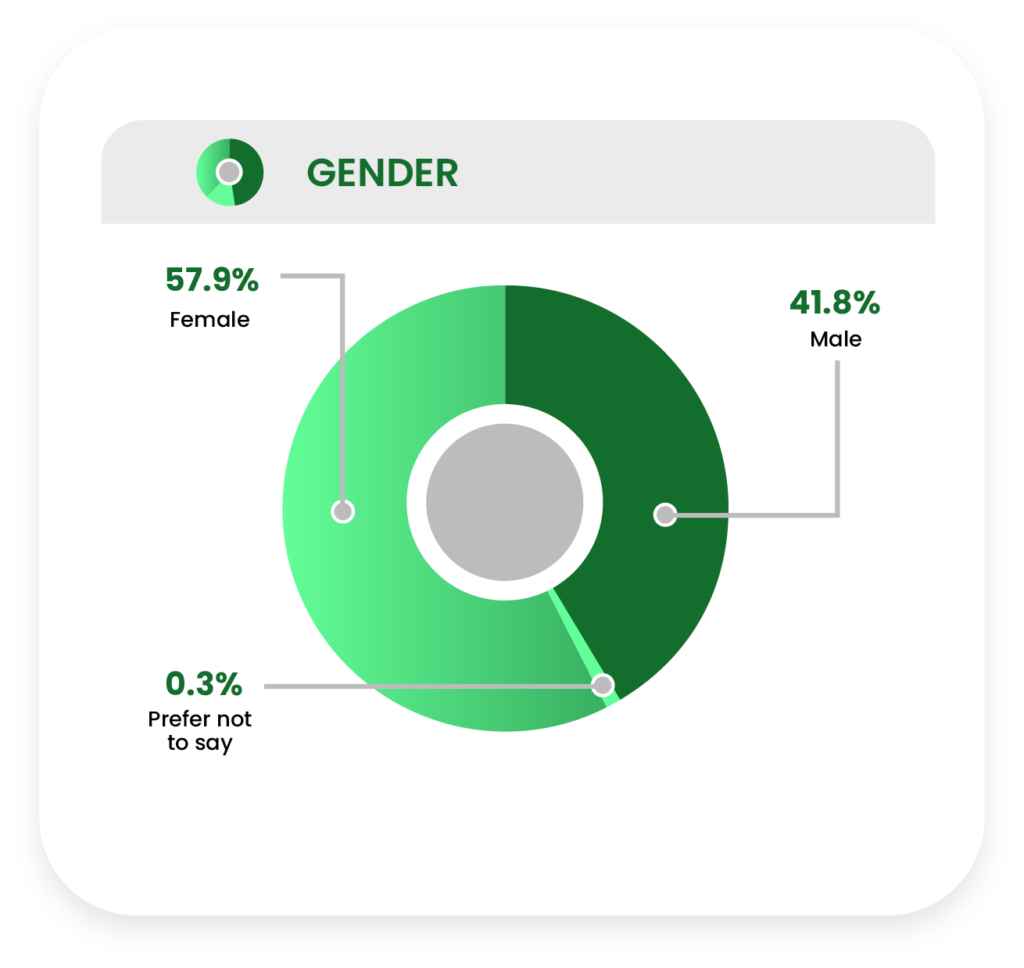
The initially small separation in gender widened in the case of former consumers, among whom 57.9% are female compared to 41.8% male.
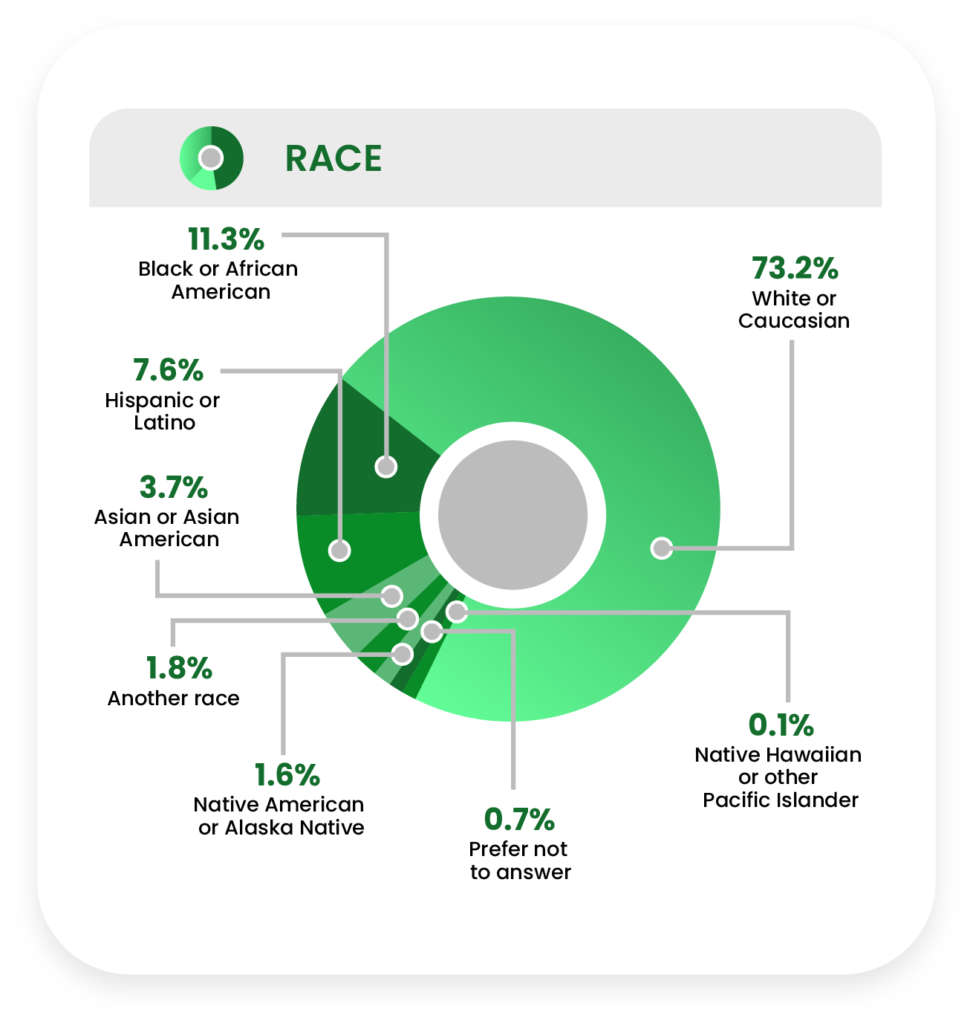
Nearly identical to the overall respondent pool, about three-fourths of past consumers were White or Caucasian (73.2%), while about a quarter (22.6%) were Black or African American, Hispanic or Latino, and Asian or Asian American.
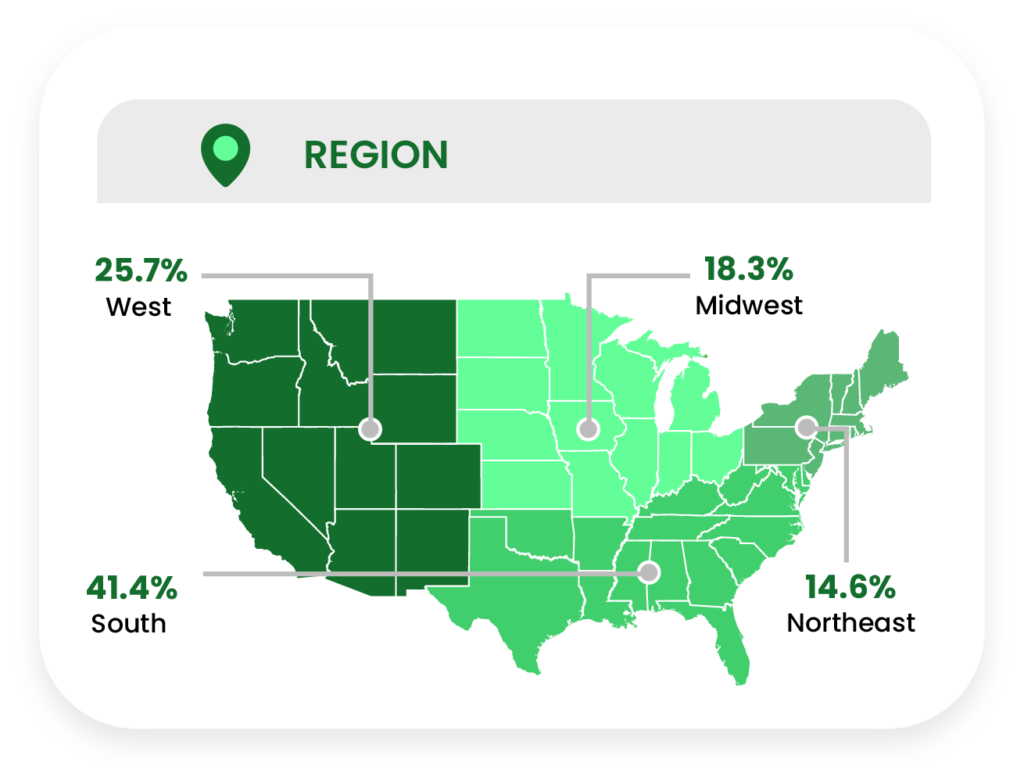
Just over a quarter of past consumers are located in the Western US (25.7%), compared to 41.4% from the South, 18.3% from the Midwest, and 14.6% from the Northeast.
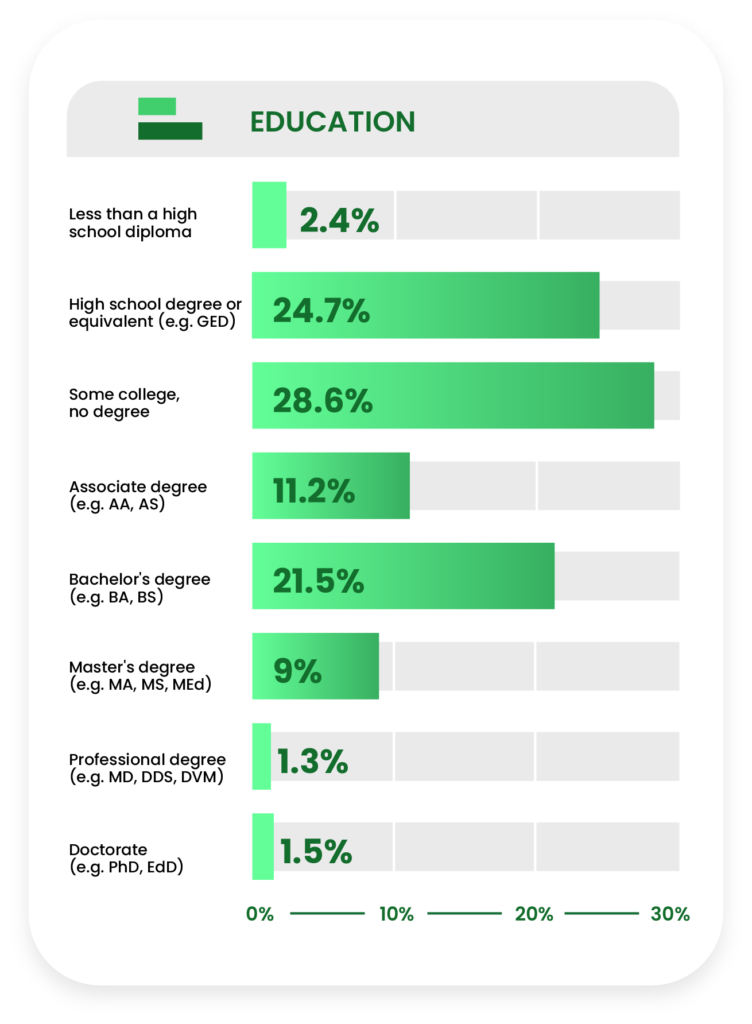
Over half of past consumers (55.7%) do not have a college degree, an increase from the total eligible respondents.
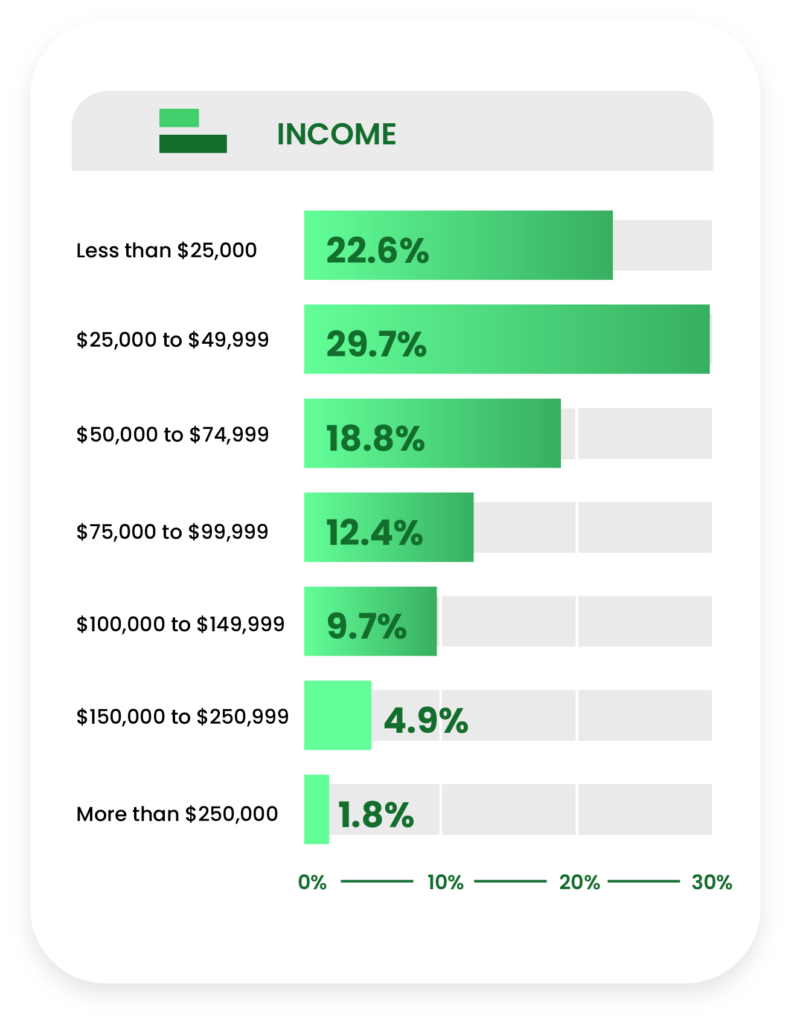
Nearly three in four past consumers (71.1%) reported having a household annual income of less than $75,000.
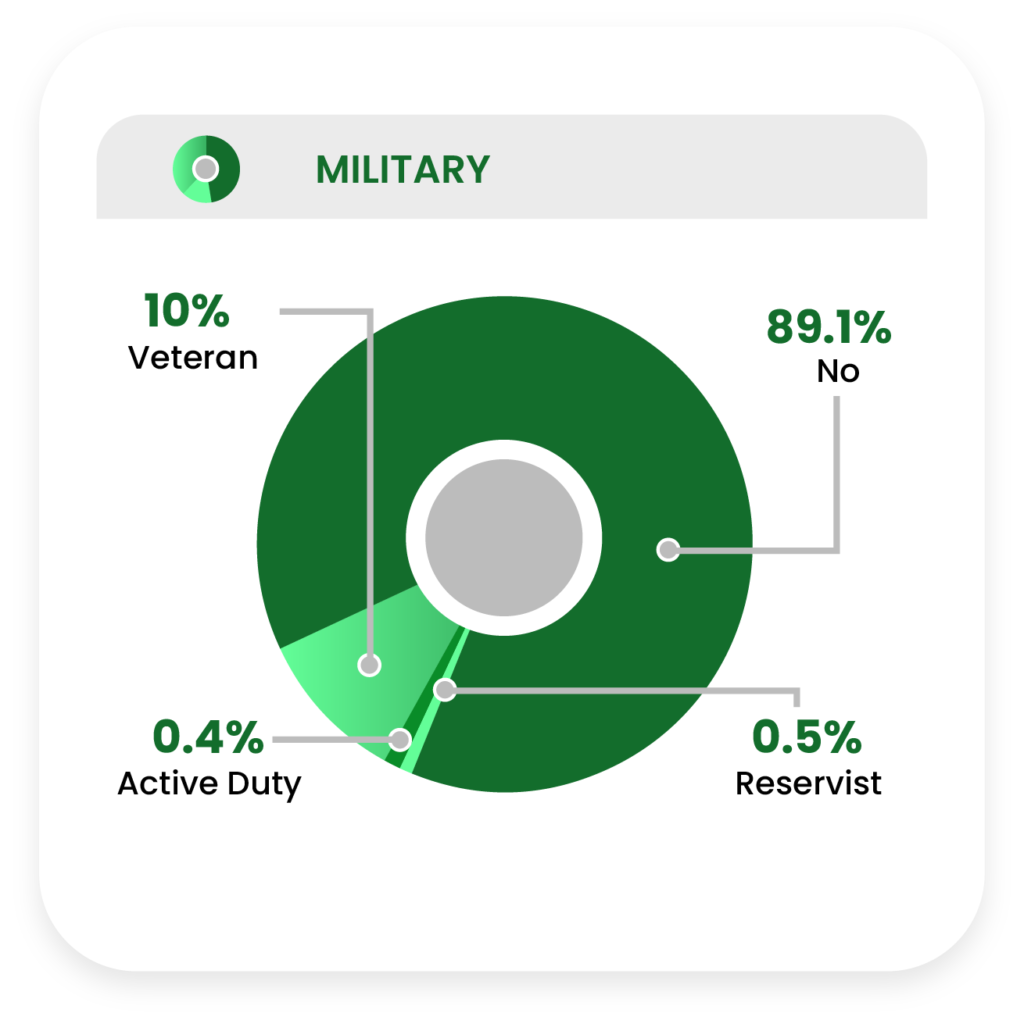
One in ten former consumers reported being part of the military in some form (10.9%).
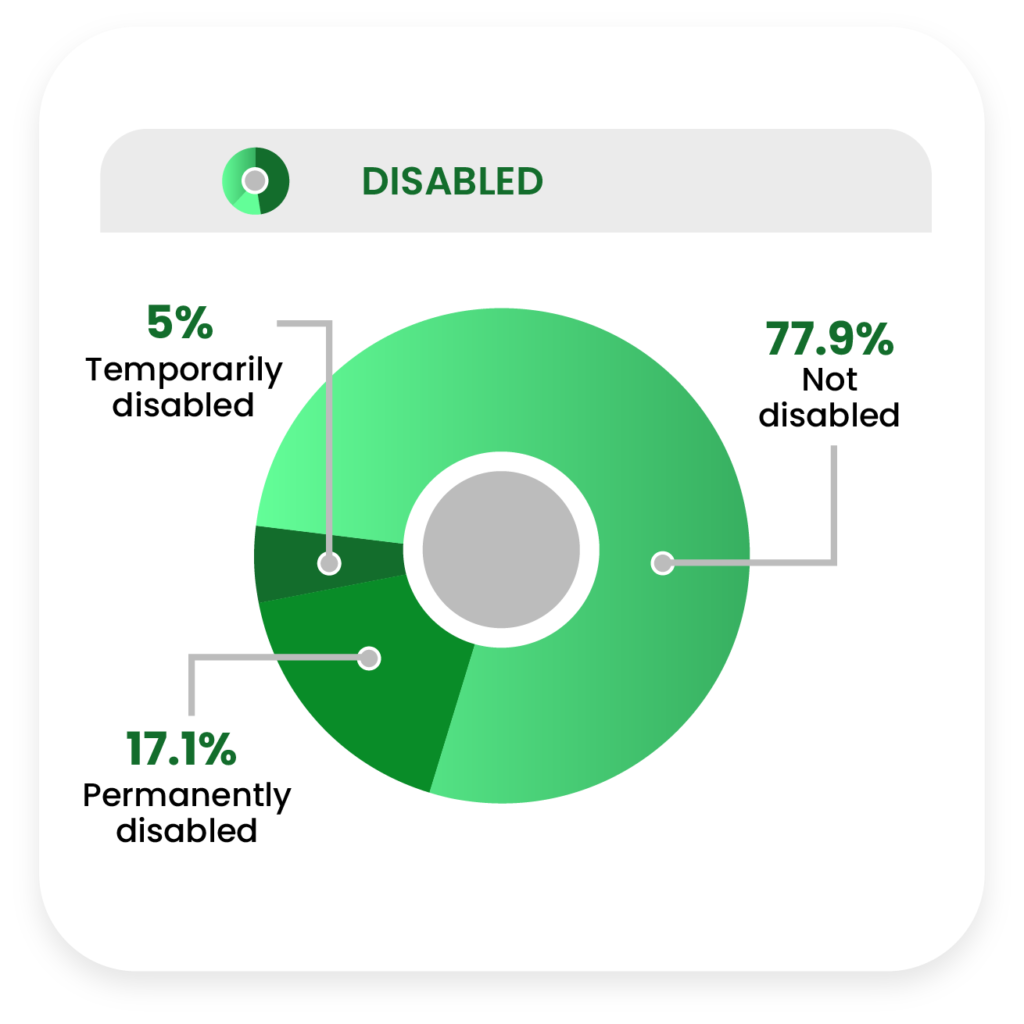
More than one in five past consumers (22.1%) reported being temporarily or permanently disabled.
Why They Stopped Using CBD
Past consumers were asked specifically why they discontinued their use of CBD, if anything could convince them to try CBD again, and, if so, what that would be.
We noticed a significant difference between age groups about the reasons past consumers stopped using CBD.
Let’s begin with the multi-faceted reasons past consumers gave up CBD, as well as the single biggest reason they stopped.
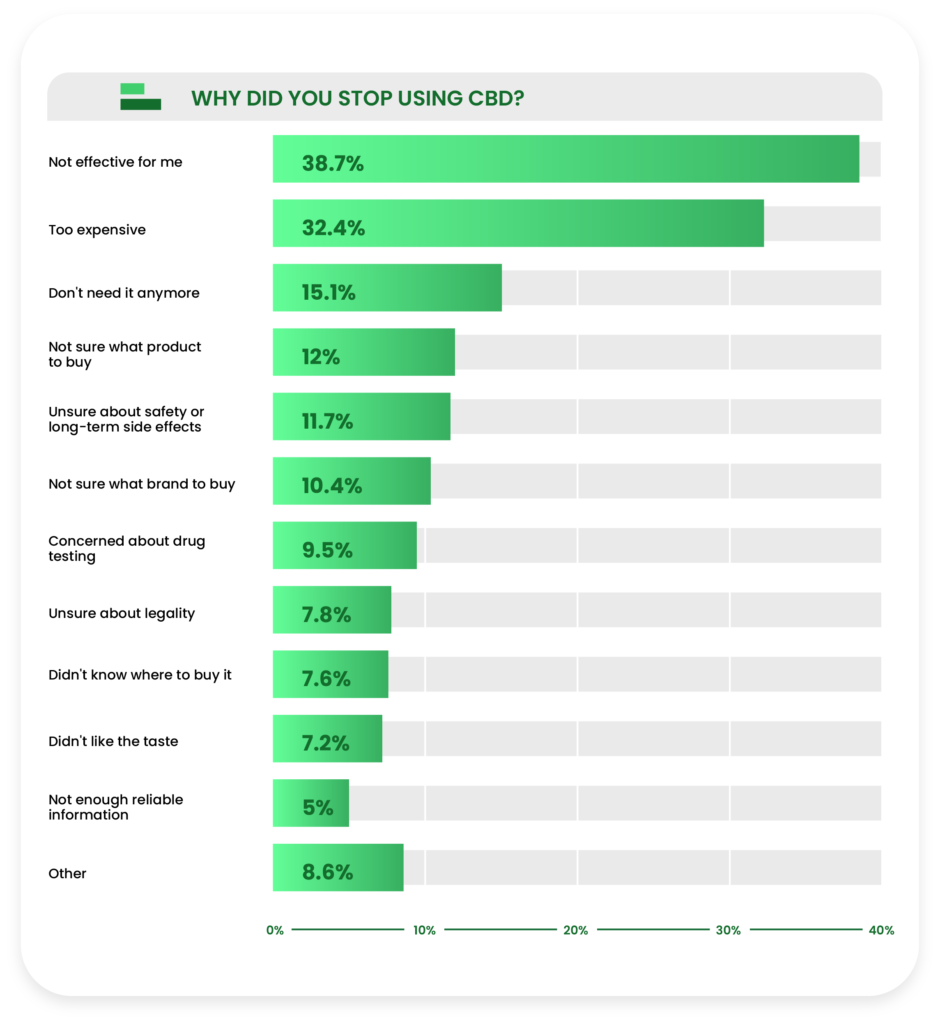
The most common reason past users stopped taking CBD was a perceived lack of effectiveness (38.7%), followed somewhat closely by the monetary expense (32.4%).
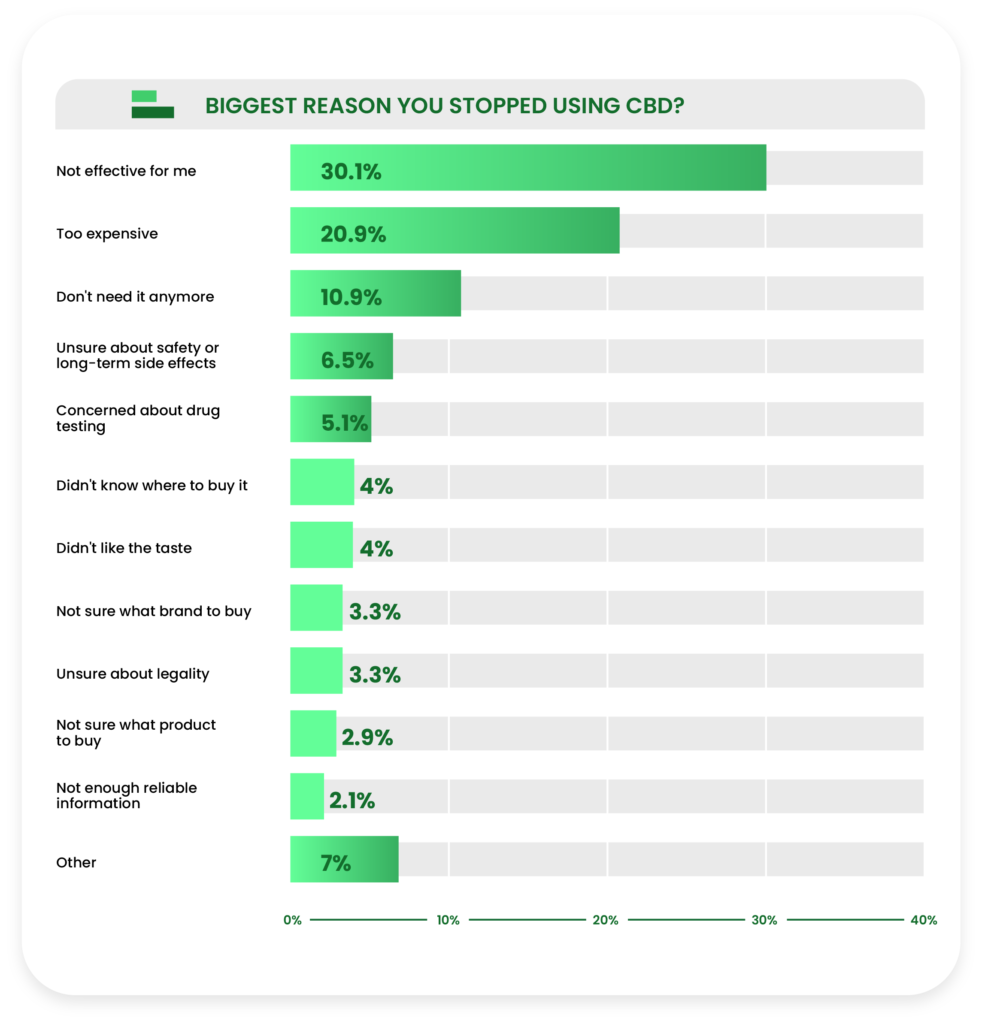
When asked to single out the number one reason former consumers stop using CBD, the gap between “not effective for me” (30.1%) and “too expensive” (20.9%) widened.
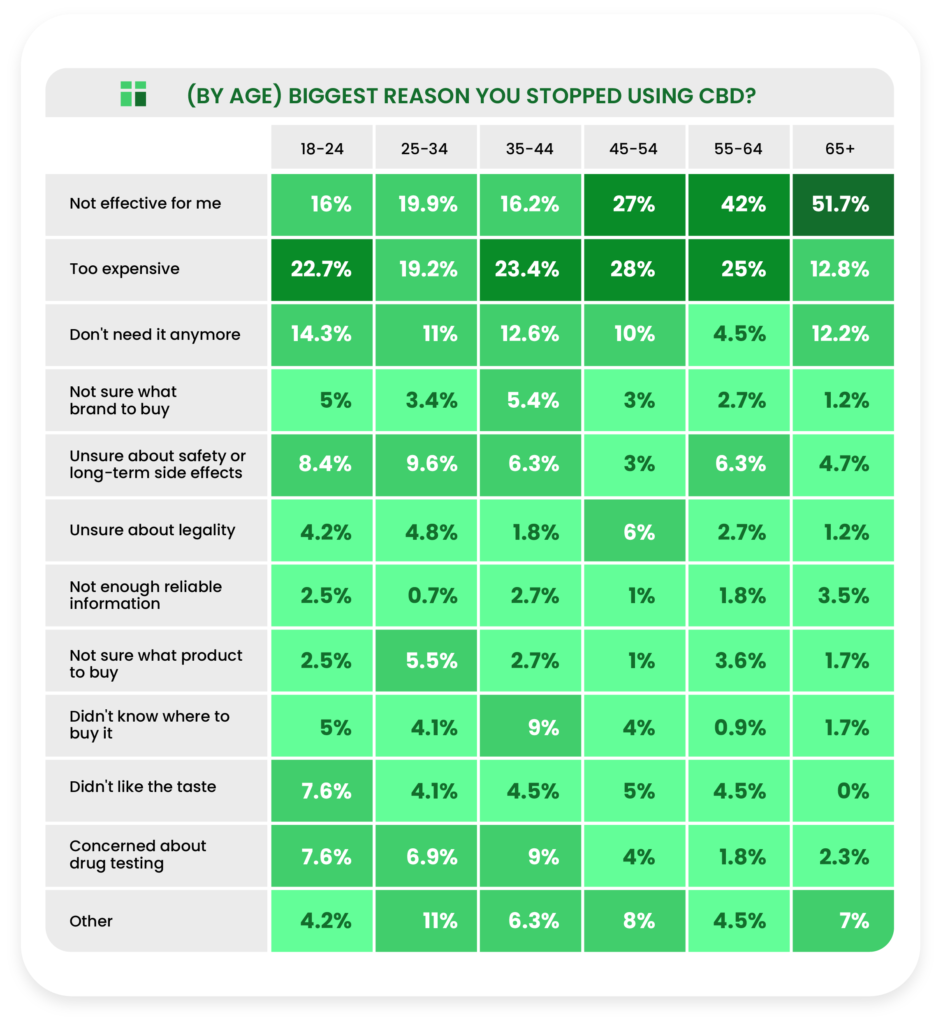
We also observed a strong discrepancy between older and younger past consumers who stated CBD was not effective for them.
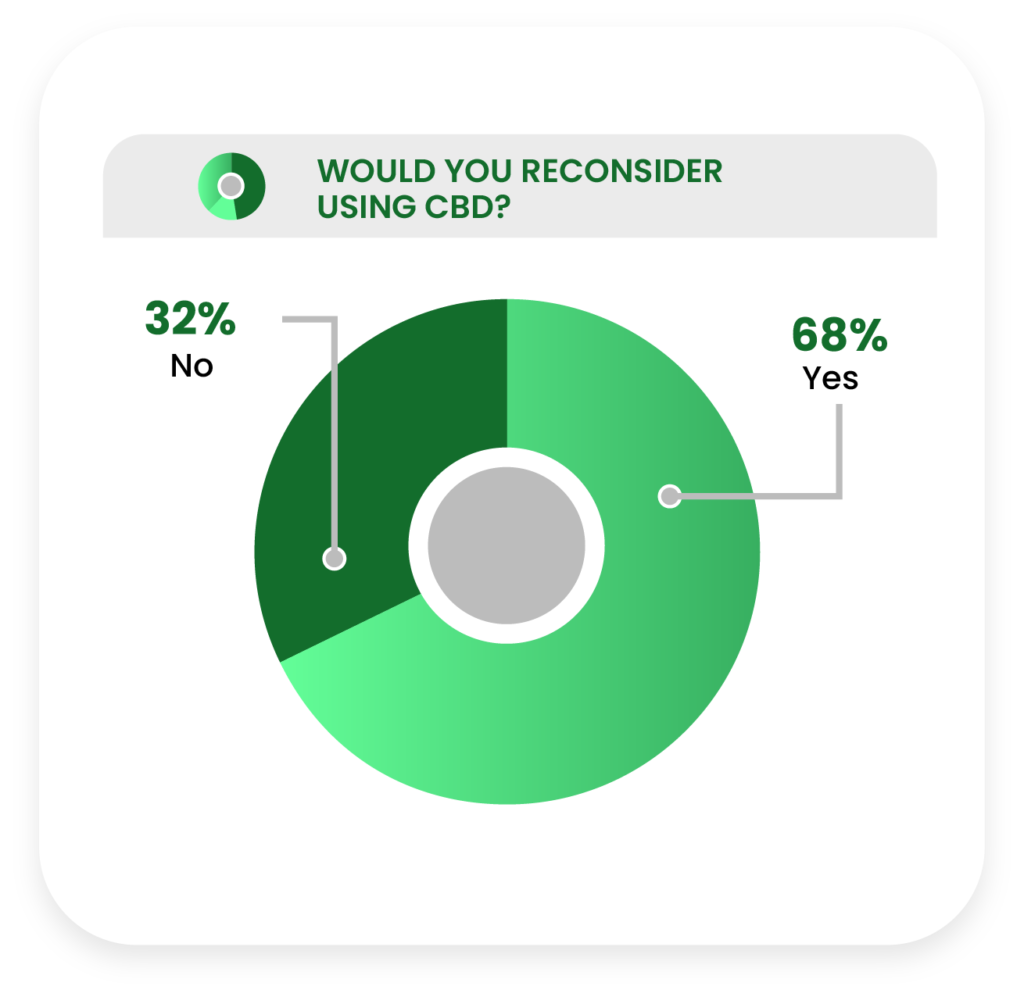
The majority of past consumers (68%) said yes when asked if there is anything that would make them reconsider using CBD.
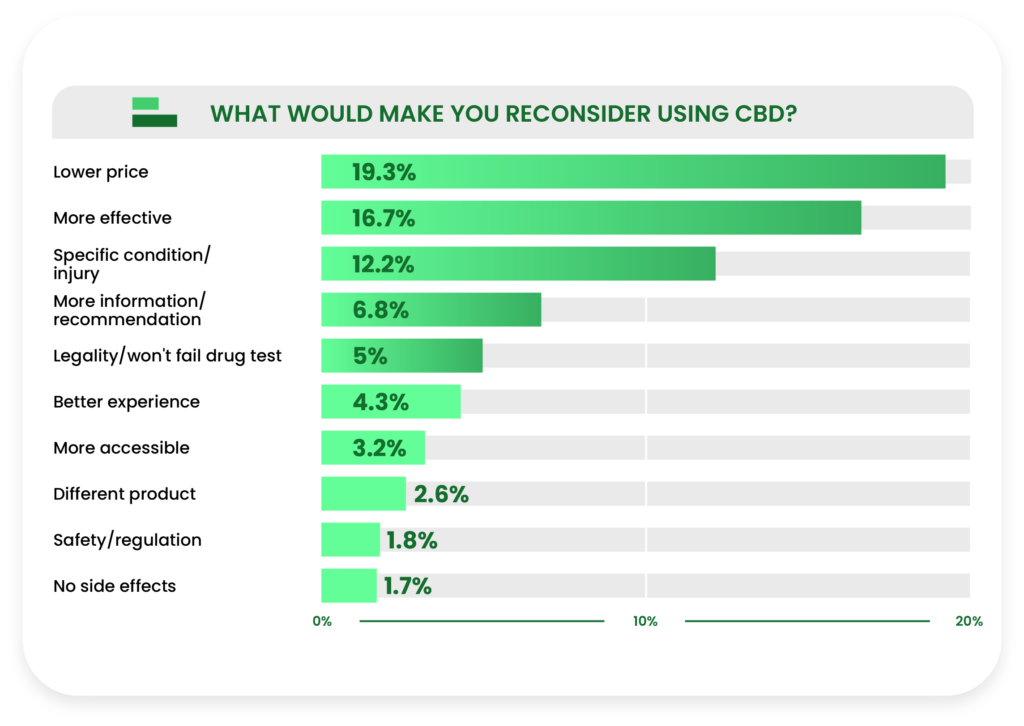
The most popular reasons that would make past consumers reconsider trying CBD were lower prices (19.3%), CBD being more effective (16.7%), or having a specific condition/injury that CBD may help (12.2%).
Behavior
We surveyed past consumers about their habits and behavior surrounding their use of CBD, including the last time they took CBD, how often they used it, and how much.
Past consumers also stated their primary sources of CBD, which were noticeably different than current consumers.
Furthermore, we discovered trends in certain aspects of the data according to age.
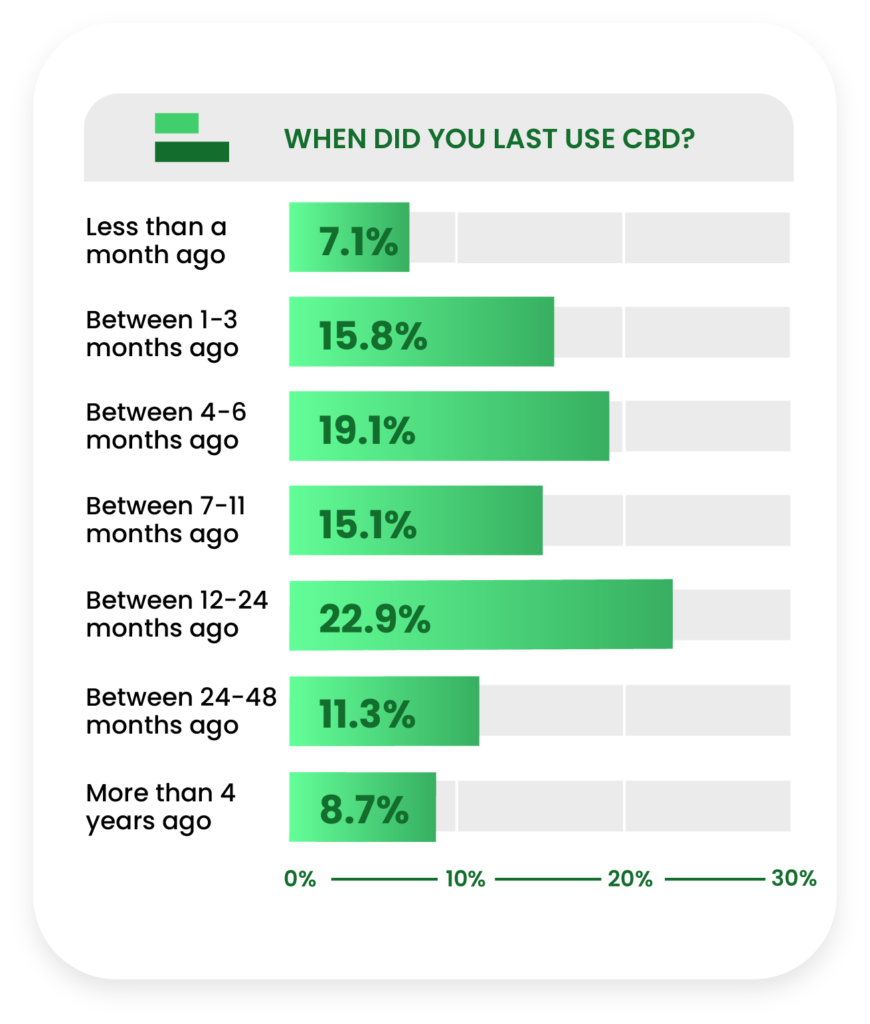
The majority of respondents (57.1%) stated the last time they used CBD was in the last 12 months before the survey, compared to 42.9% who hadn’t had any in more than a year.
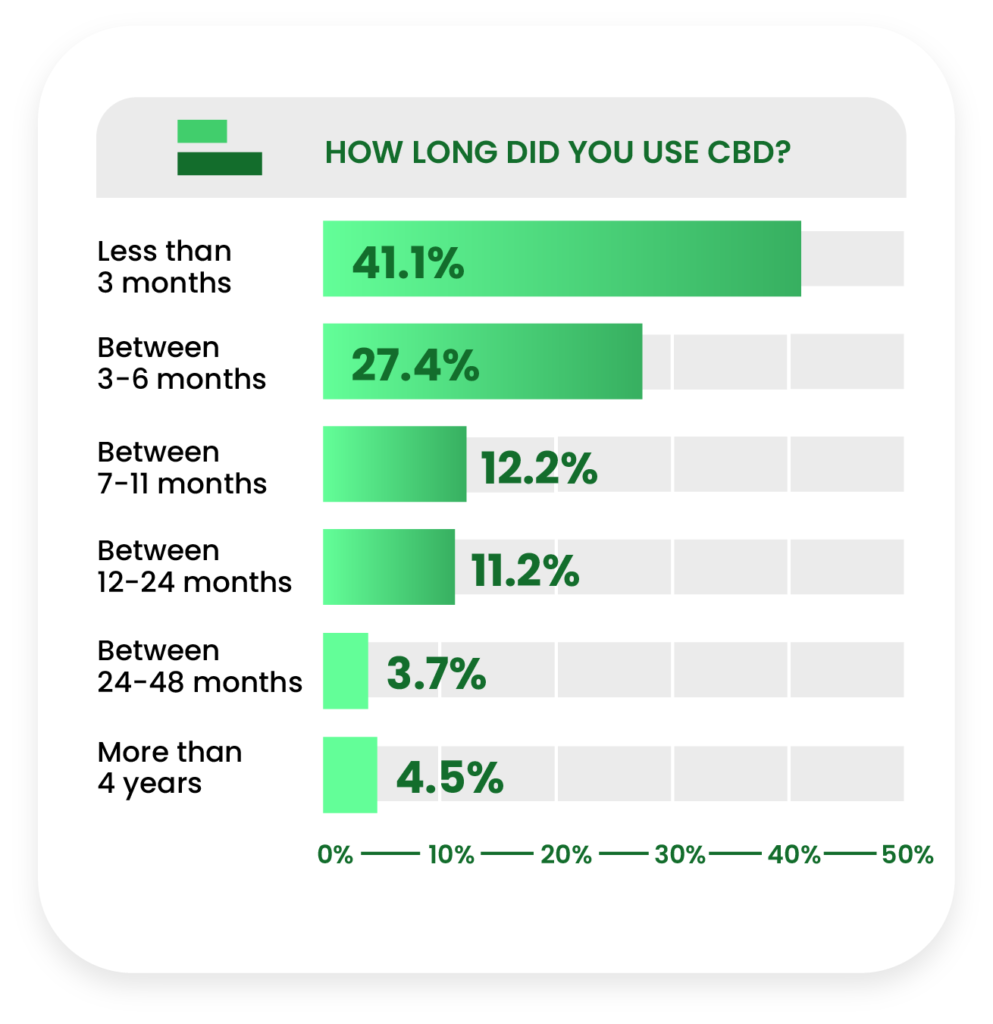
As for how long past consumers used CBD, responses declined sharply as time intervals went up, from 41.1% who used it for less than three months to 3.7% who used it for between 24 and 48 months.
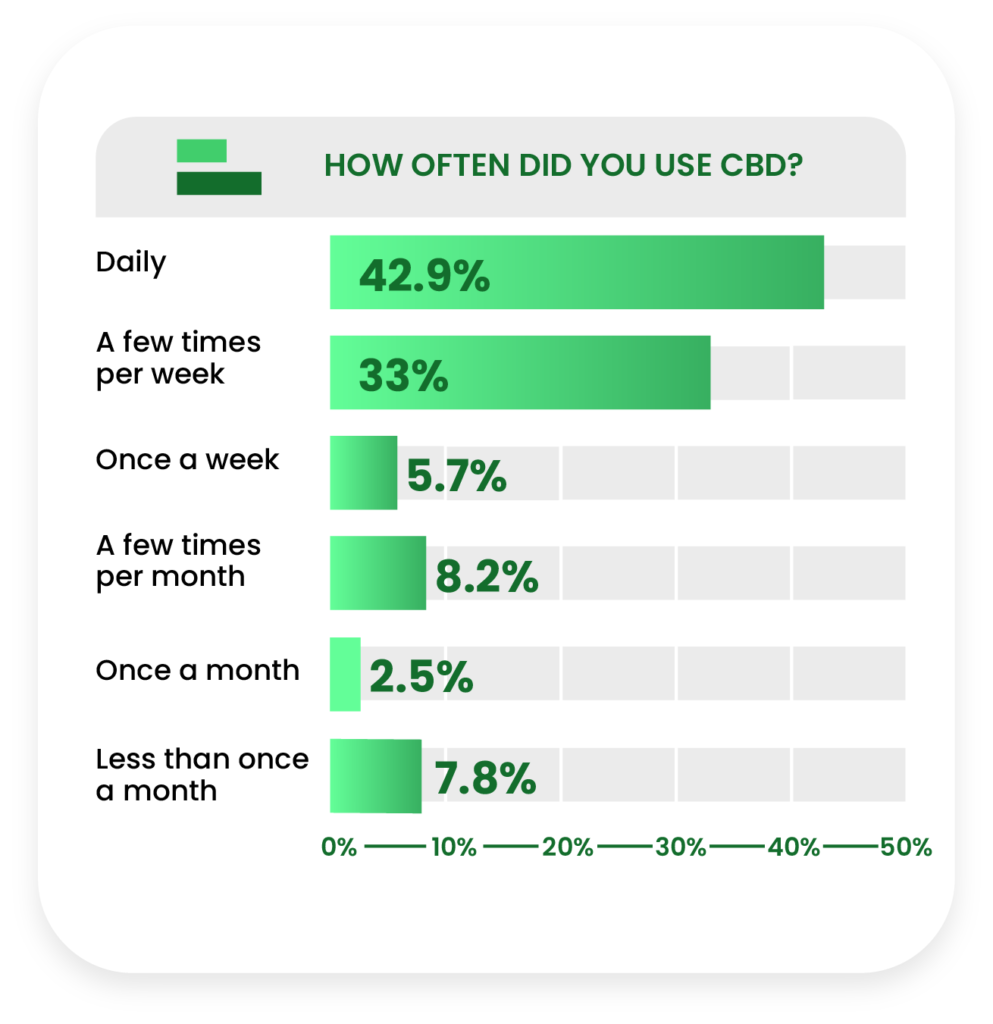
Daily users were the largest group as far as dose frequency is concerned (42.9%), followed by 33% who used CBD a few times per week and a sharp dropoff for once a week (5.7%) and lower frequencies.
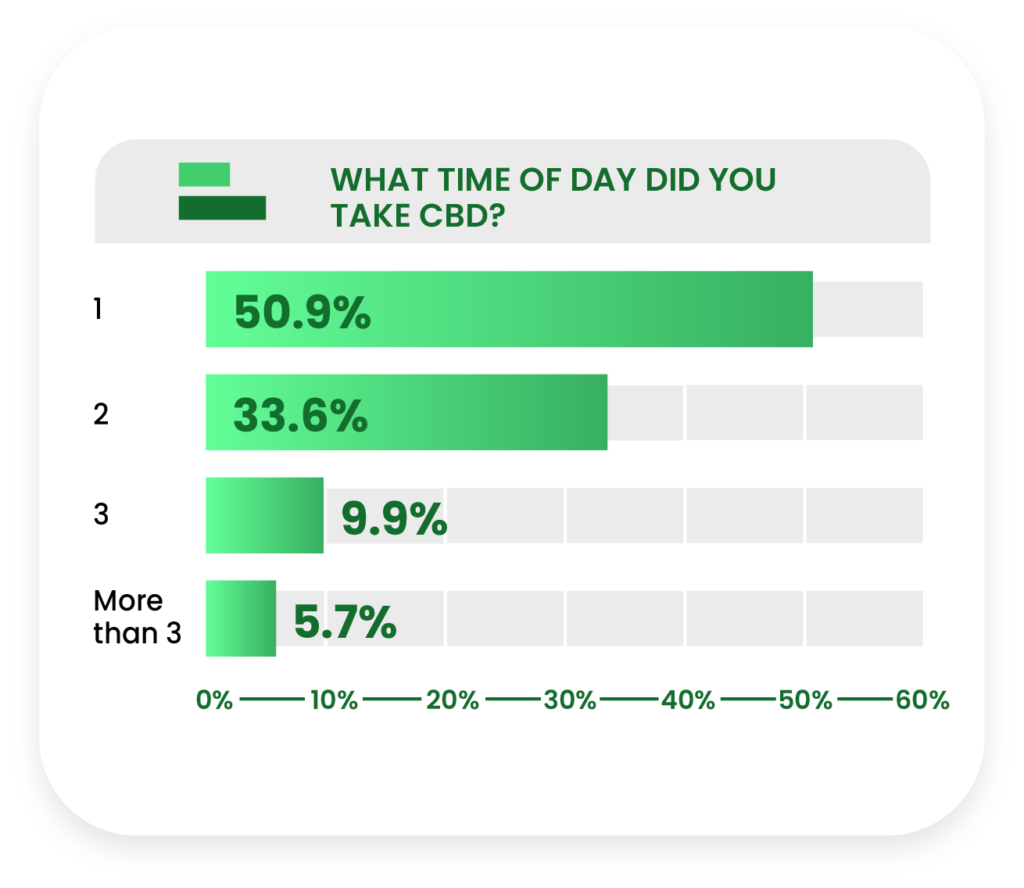
Just over half of former CBD users (50.9%) would take CBD once on days they used it, dropping off sharply for twice a day (33.6%) and three times a day (9.9%). A smaller portion (5.7%) took CBD more than three times a day.
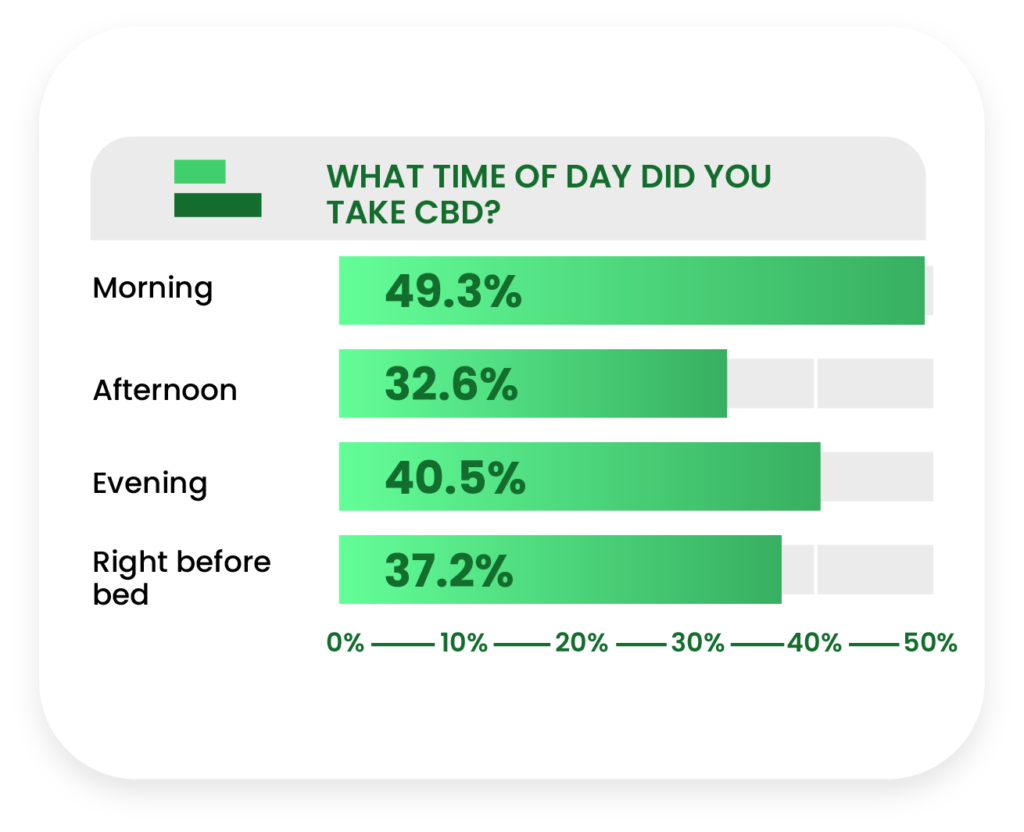
The morning is the most popular time to take CBD (49.3%) in this consumer subgroup, but once again, evening (40.5%) is gaining ground as sleep formulations continue to circulate.
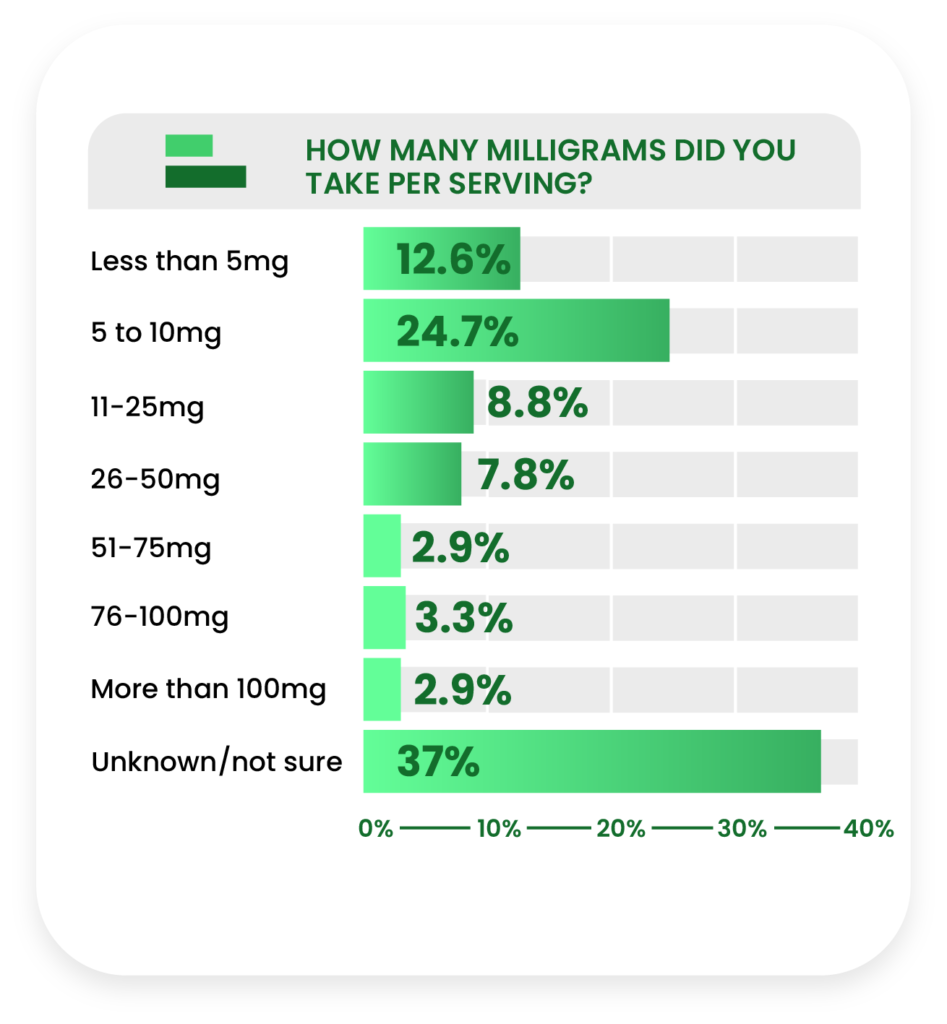
More than a third of past consumers (37%) were unsure of how many milligrams of CBD they were getting per serving (followed by 5-10mg at 24.7%).
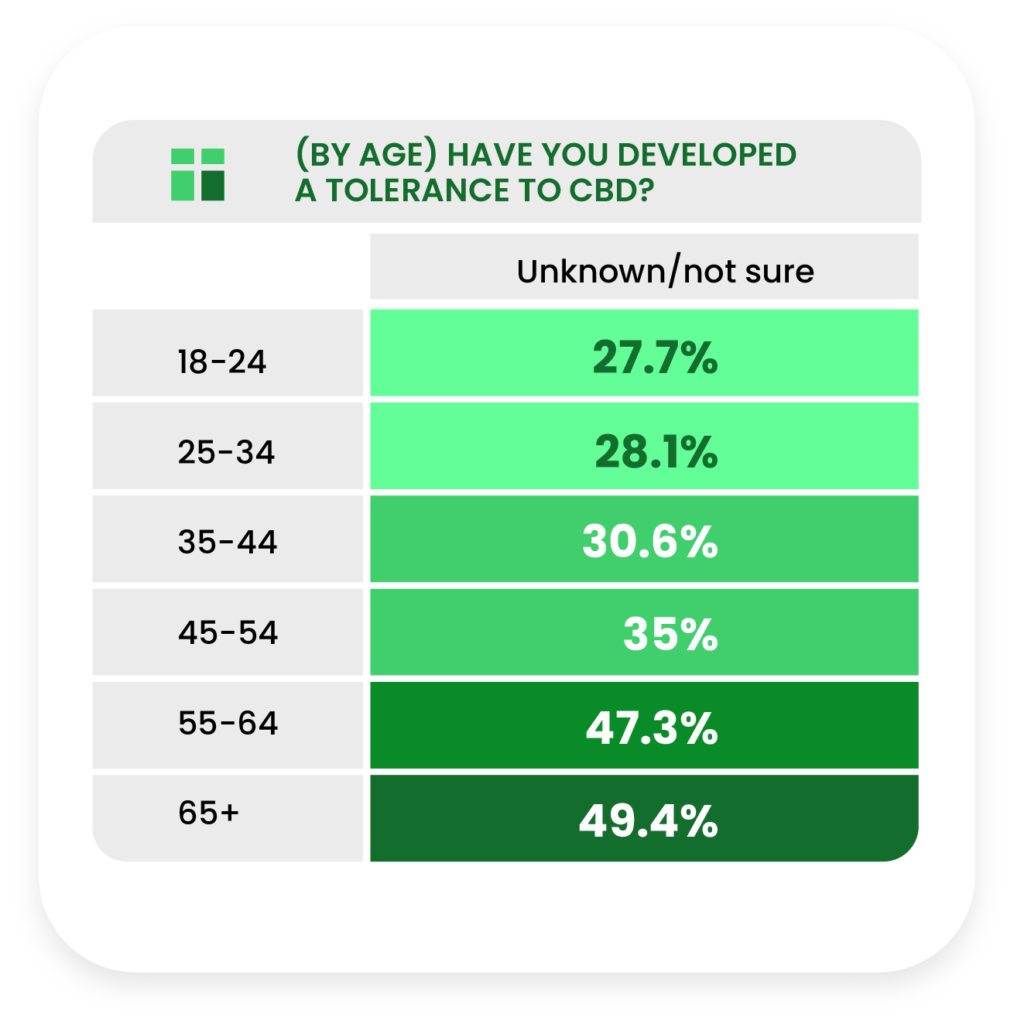
This uncertainty level worsened consistently with increasing age, trending upward from 27.7% in the 18-24 group to 49.4% in the 65+ group.
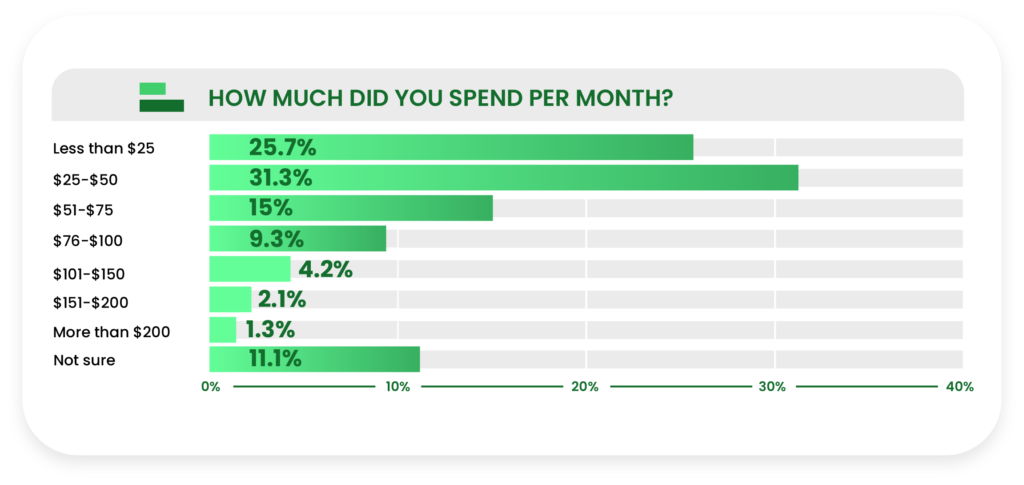
Almost a third of former consumers (31.3%) would spend between $25-$50 a month on CBD, while the numbers dipped sharply and steadily from that price point.
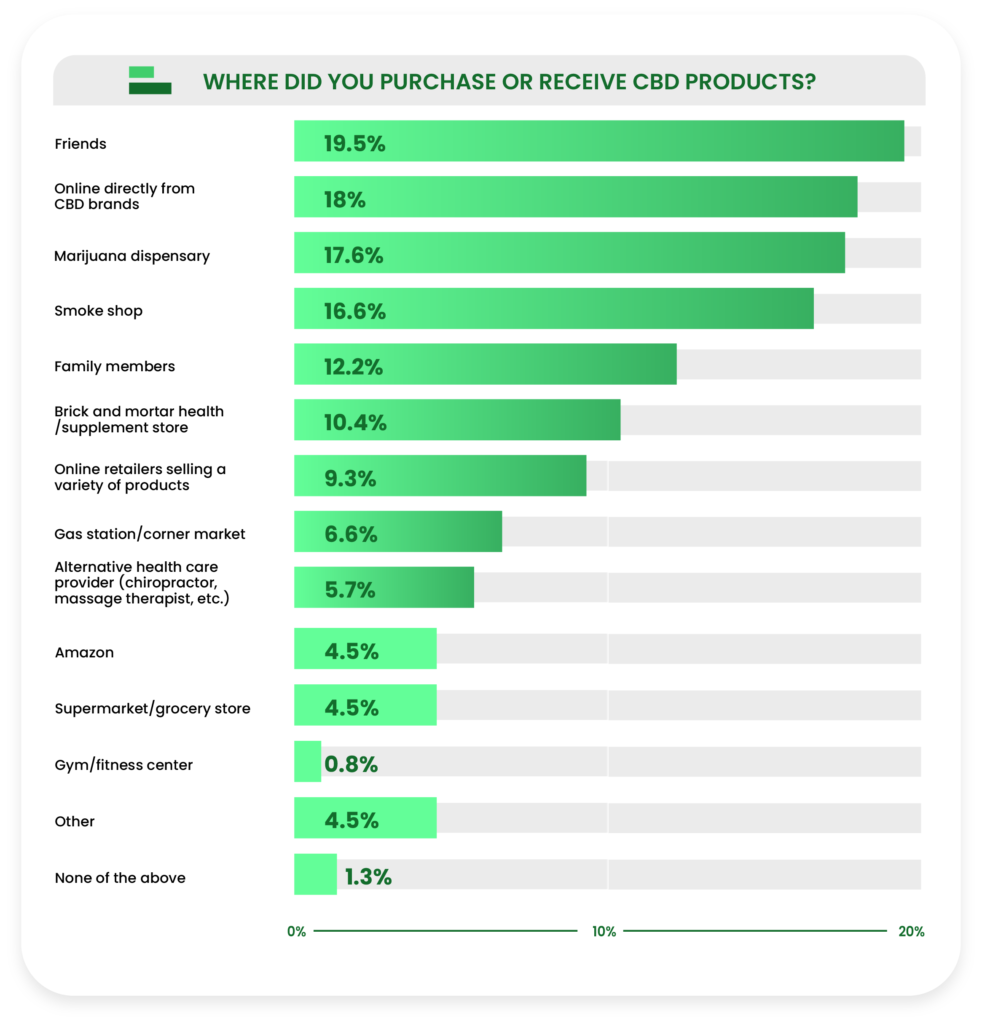
Friends were the most common source (19.5%) of CBD for past consumers, but not by much—direct online sales (18%), marijuana dispensaries (17.6%), and smoke shops (16.6%) trailed closely behind.
Product Preferences
While both current and past consumers were asked about their product preferences, we filtered the data by consumer status to find out how the two differed.
We found that past consumers tried a less diverse range of products than current consumers and had a more conclusively determined preferred product.
CBD oils/tinctures were the most tried and preferred product type.
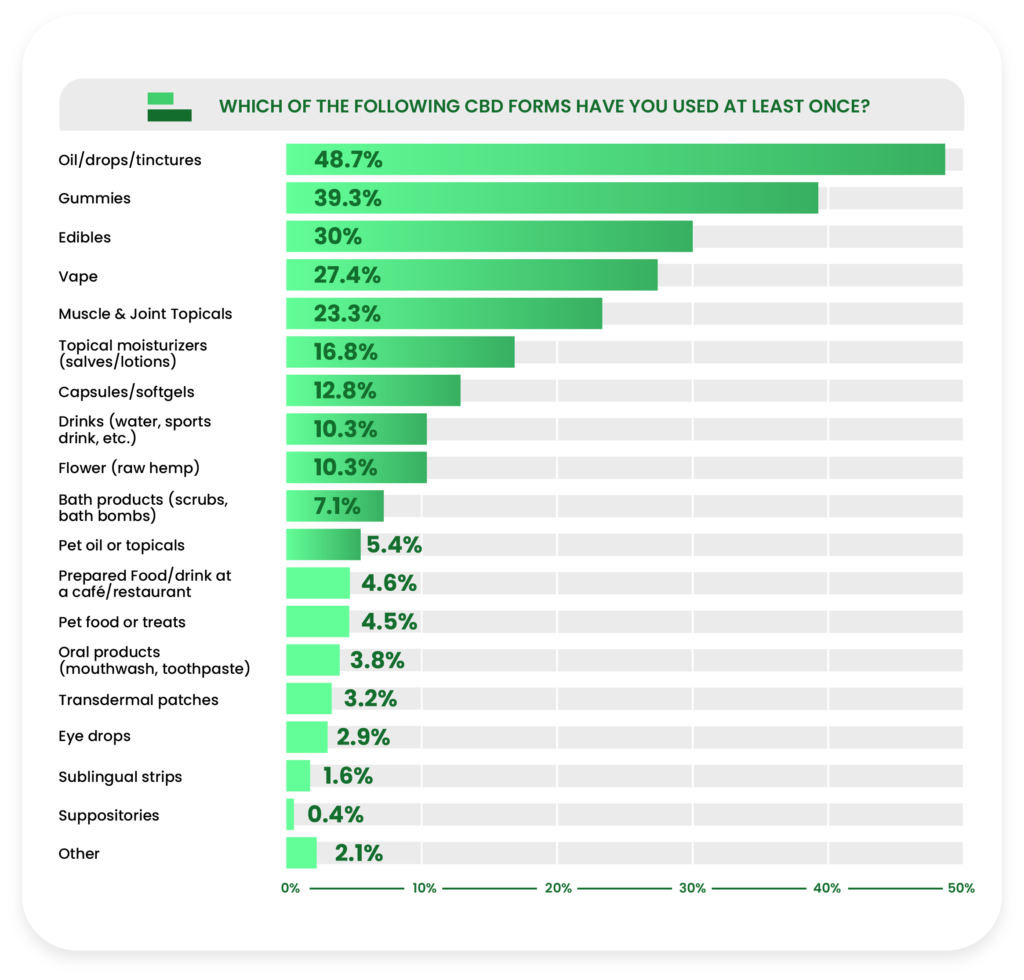
As expected, the most commonly used forms of CBD among former consumers was oil/drops/tinctures (48.7%), followed by gummies (39.3%) and edibles (30%).
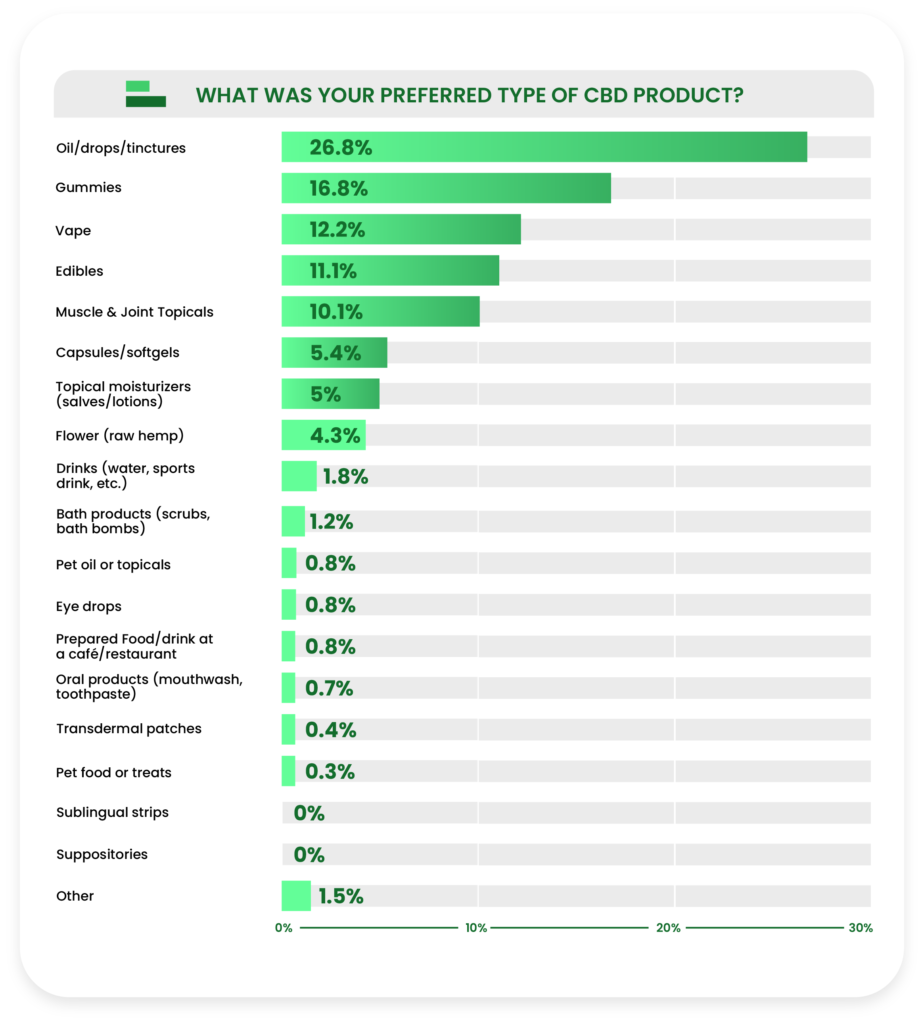
CBD oil also led the field for preferred product type (26.8%), beating gummies (16.8%) and edibles (11.1%) by similarly convincing margins.
Reasons for Use and Perceived Effectiveness
Past consumers were asked about the specific reasons
they used CBD, as well as how effective they found CBD to be for those reasons.
We also found out how often past consumers supplement
replace a medication with CBD.
Interestingly, we found significant differences between age groups about the perceived effectiveness of CBD for some reasons past consumers used CBD.
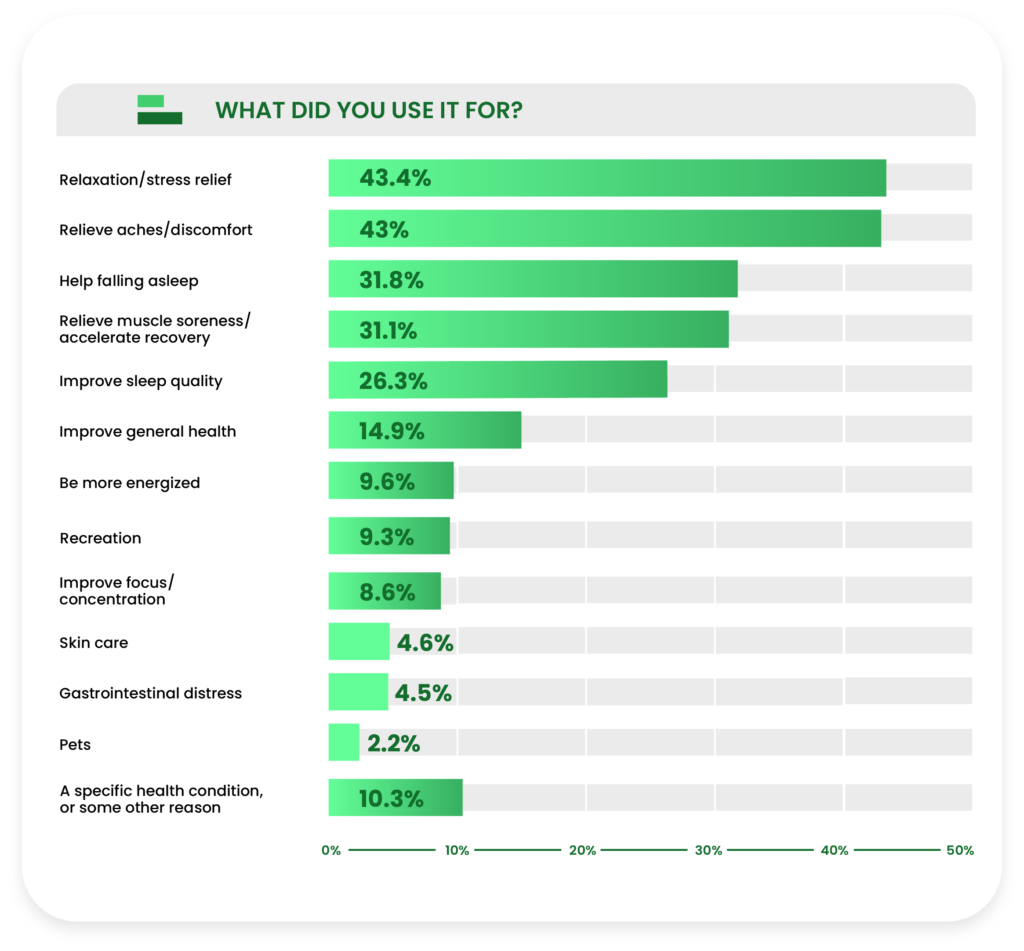
“Relaxation and stress relief” (43.4%) and “relieve aches/discomfort” (43%) almost tied for the most commonly selected reasons that former CBD users took CBD.
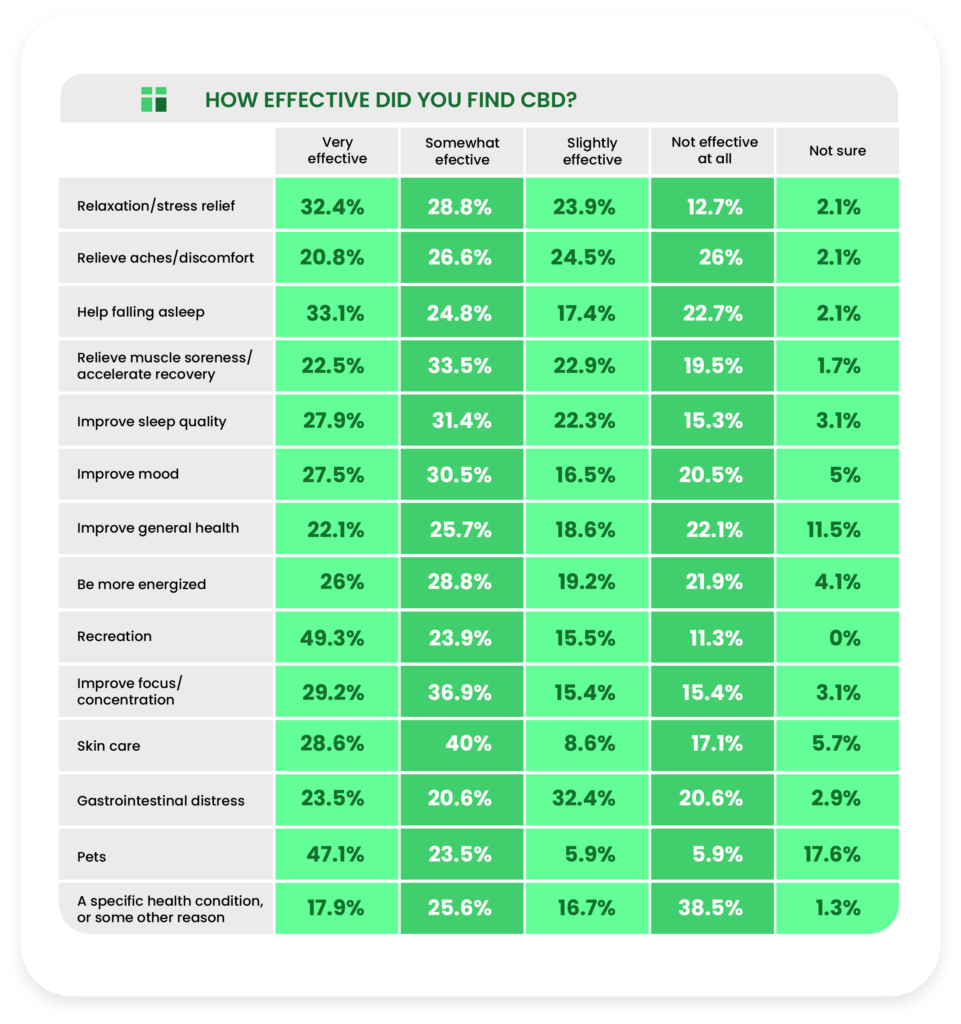
Among the most commonly cited reasons for using CBD among past consumers, not quite a third of respondents (32.4%) said they found it very effective for relaxation. Additionally, only 20.8% found CBD very effective for aches and discomfort.
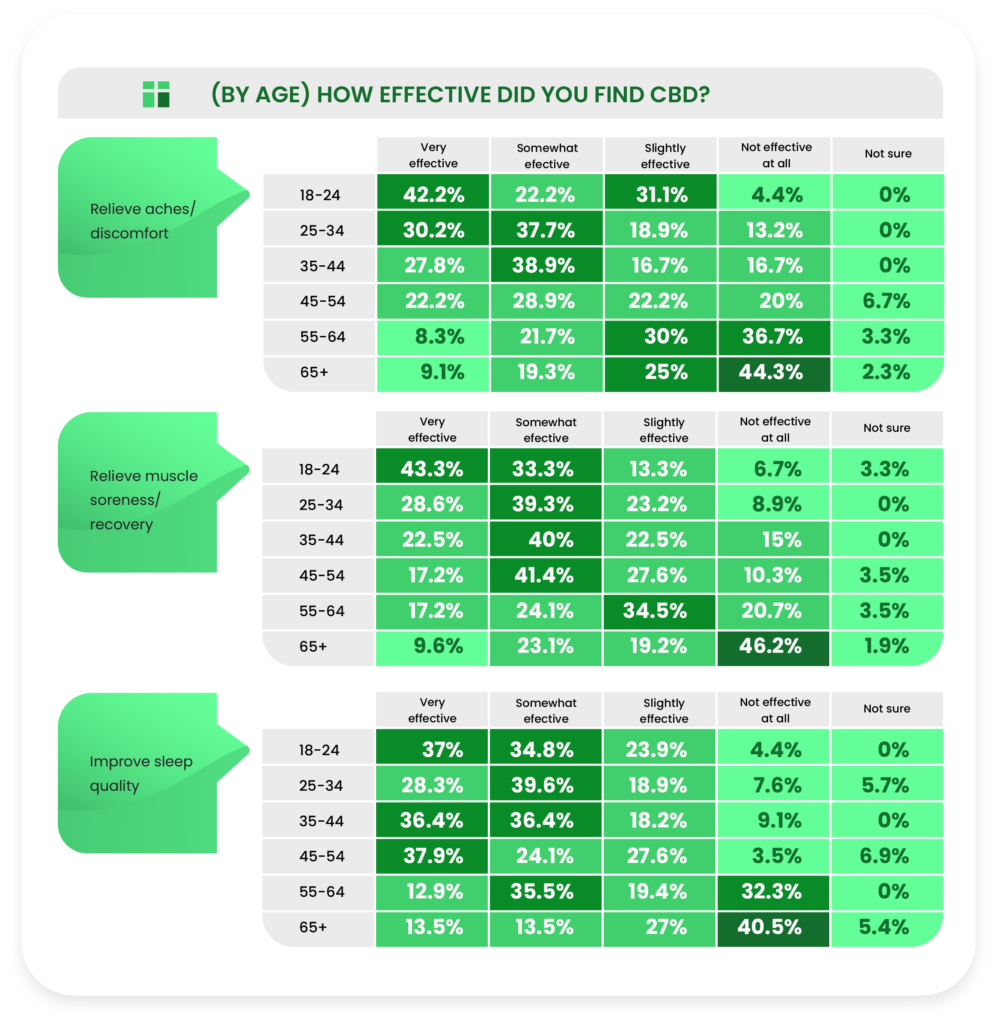
Regarding the perceived effectiveness for relieving aches and discomfort, there was a strong downward trend from those 18-24 (42.2% found CBD very effective) to those 65+ (9.1% very effective).
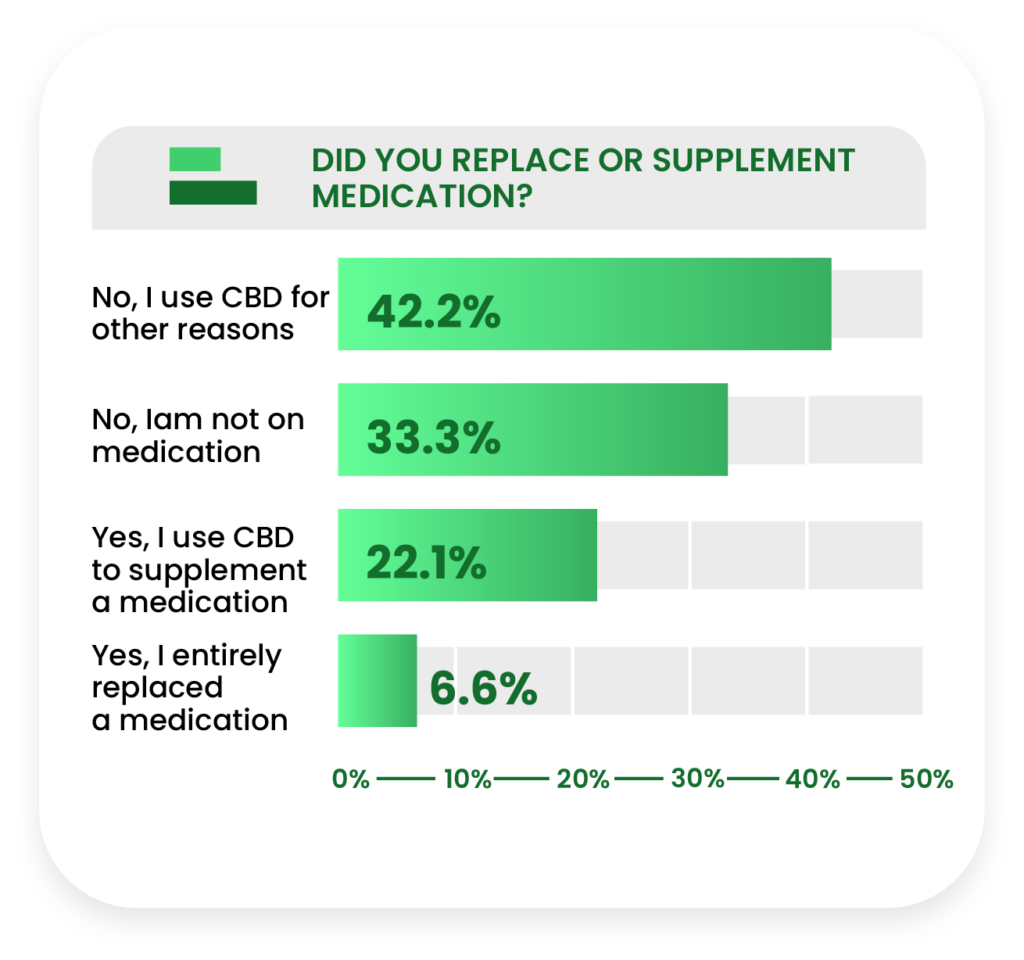
The majority of past consumers (75.5%) were either not on medication or not using CBD to supplement/replace a medication. More respondents used CBD to supplement (22.1%) than replace (6.6%) medications.
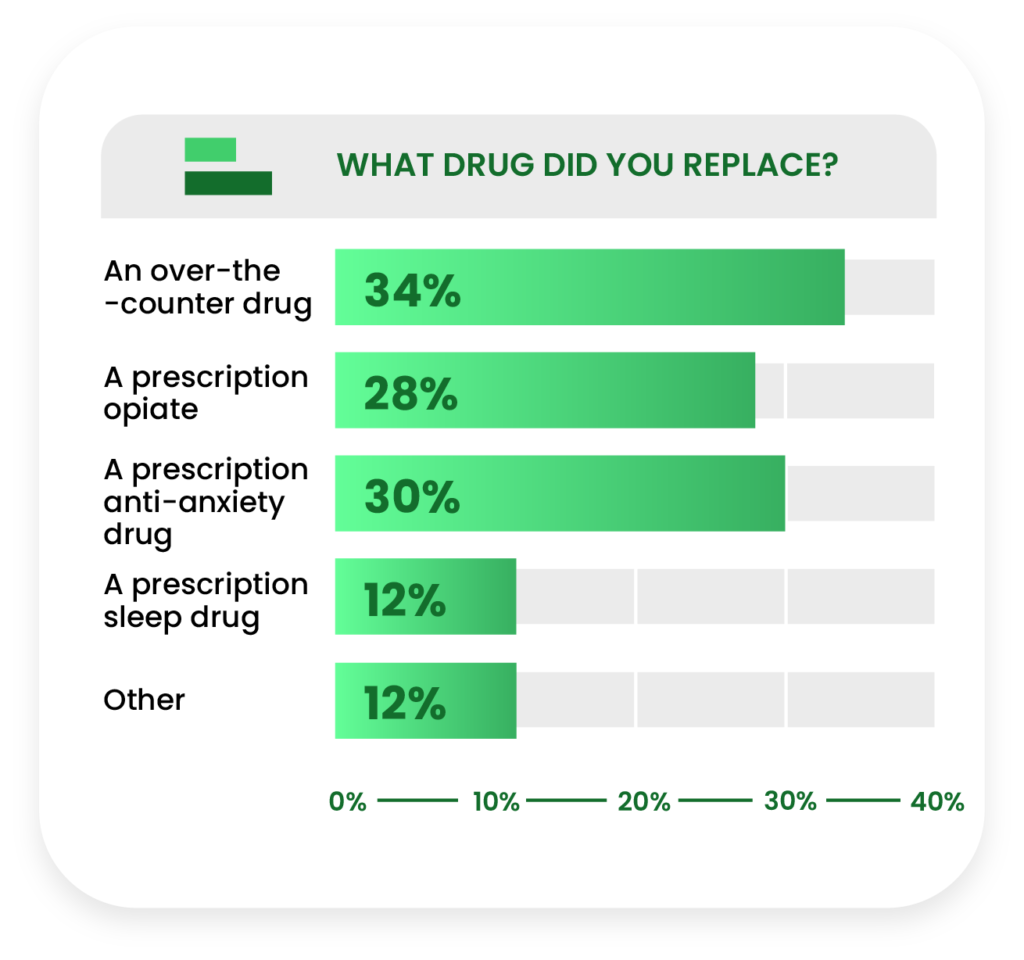
Among respondents who did replace a drug with cannabidiol, 34% reportedly used it to get rid of over-the-counter drugs, followed by 30% who used it to replace prescription anti-anxiety drugs.
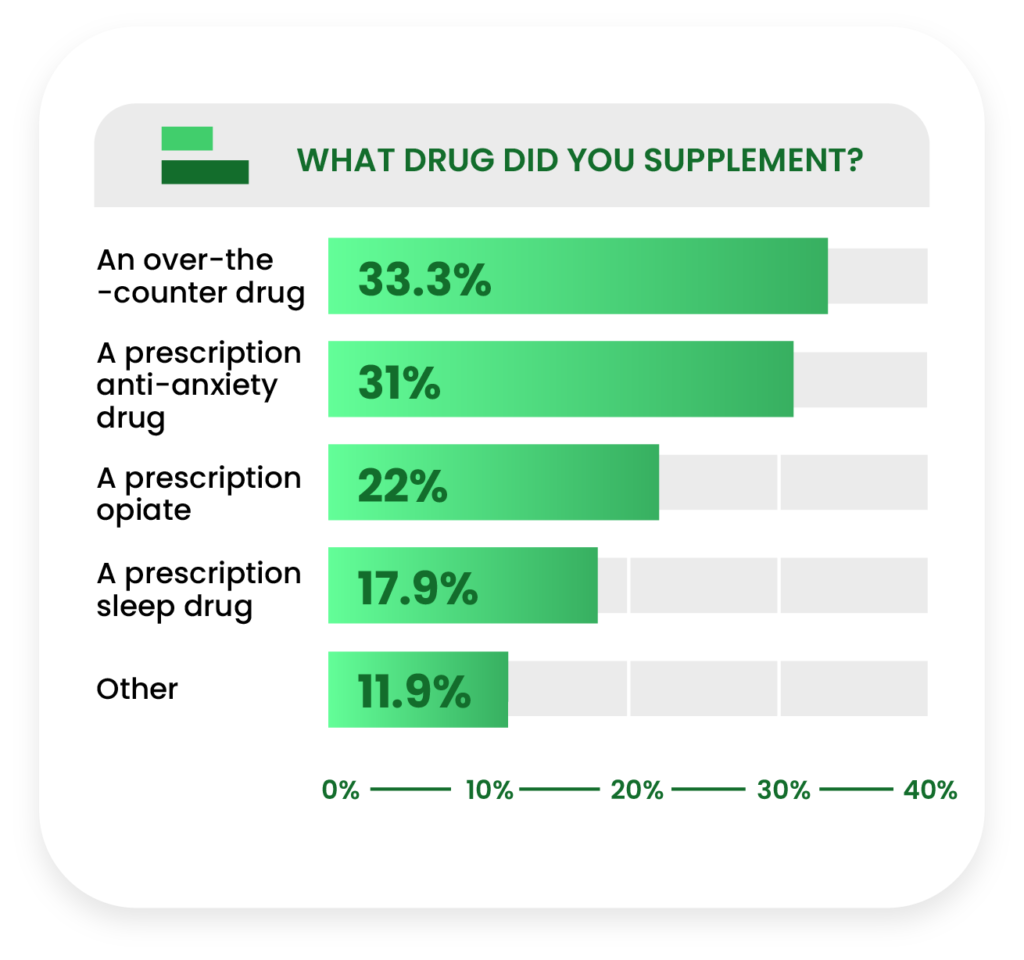
The figures were almost identical for those who supplemented drugs with CBD, with 33.3% supplementing over-the-counter drugs and 31% supplementing prescription anti-anxiety drugs.
Concerns About CBD
We asked past consumers about their concerns with CBD, including if they believed they developed a tolerance toward CBD and if they experienced any side effects.
Fewer past consumers reported developing a tolerance to CBD than current consumers, while slightly more reported noticing side effects.
Let’s begin with the number of respondents who claimed to develop tolerance.
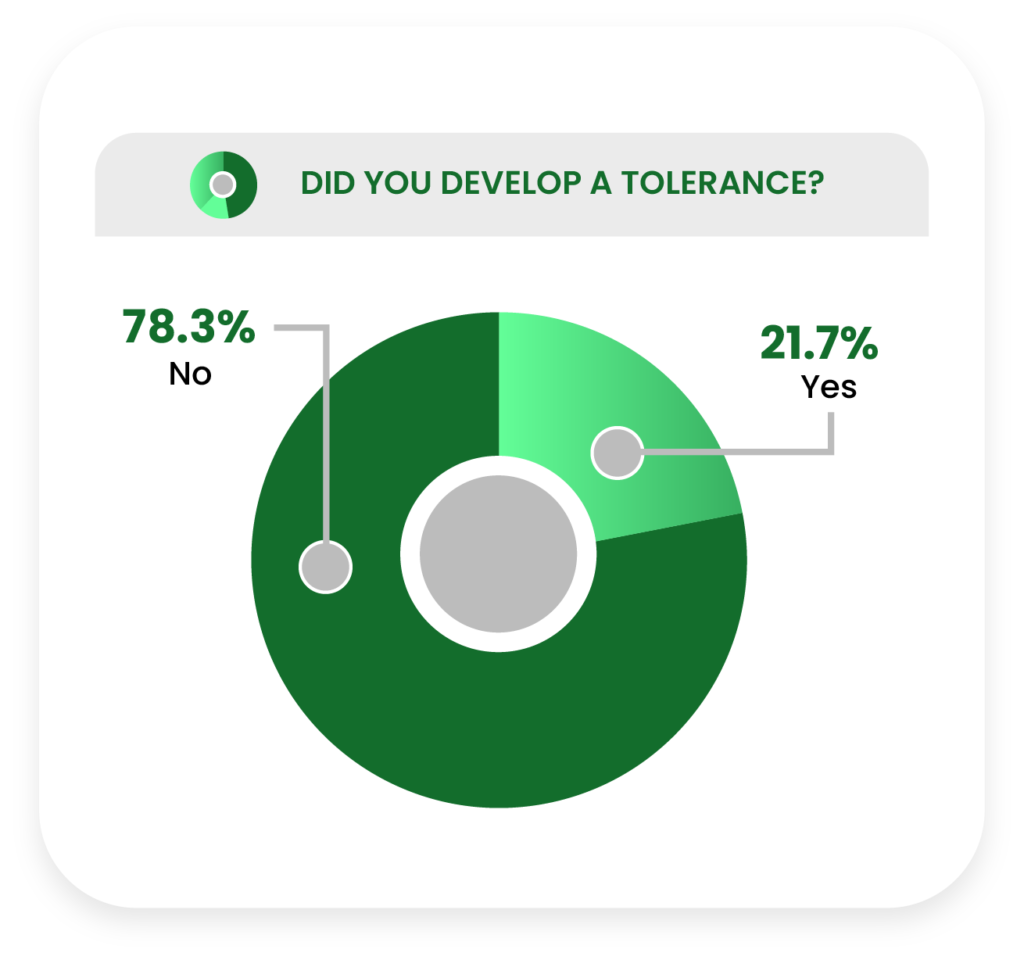
An overwhelming 78.3% of former consumers denied that they ever developed a tolerance to CBD that required them to increase serving sizes over time.
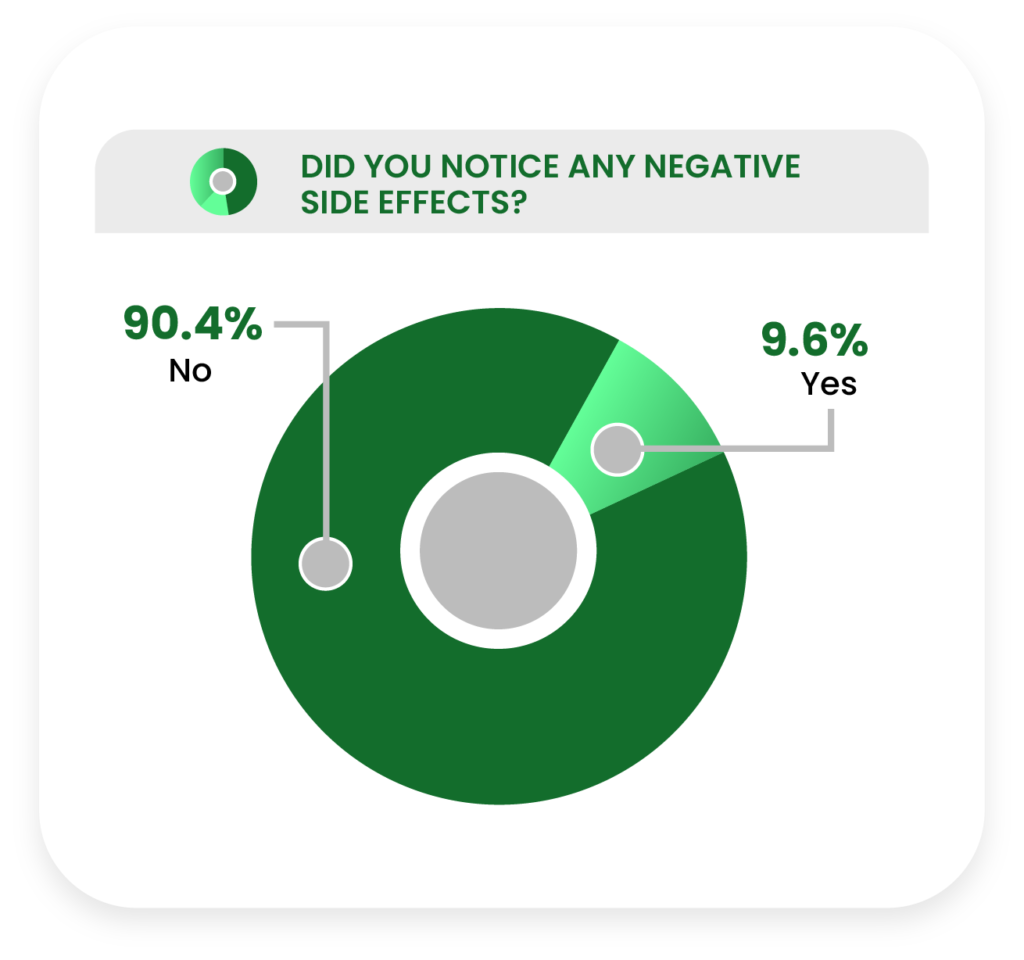
An even larger majority of former CBD consumers (90.4%) claimed they did not notice any negative side effects throughout their history of CBD use.
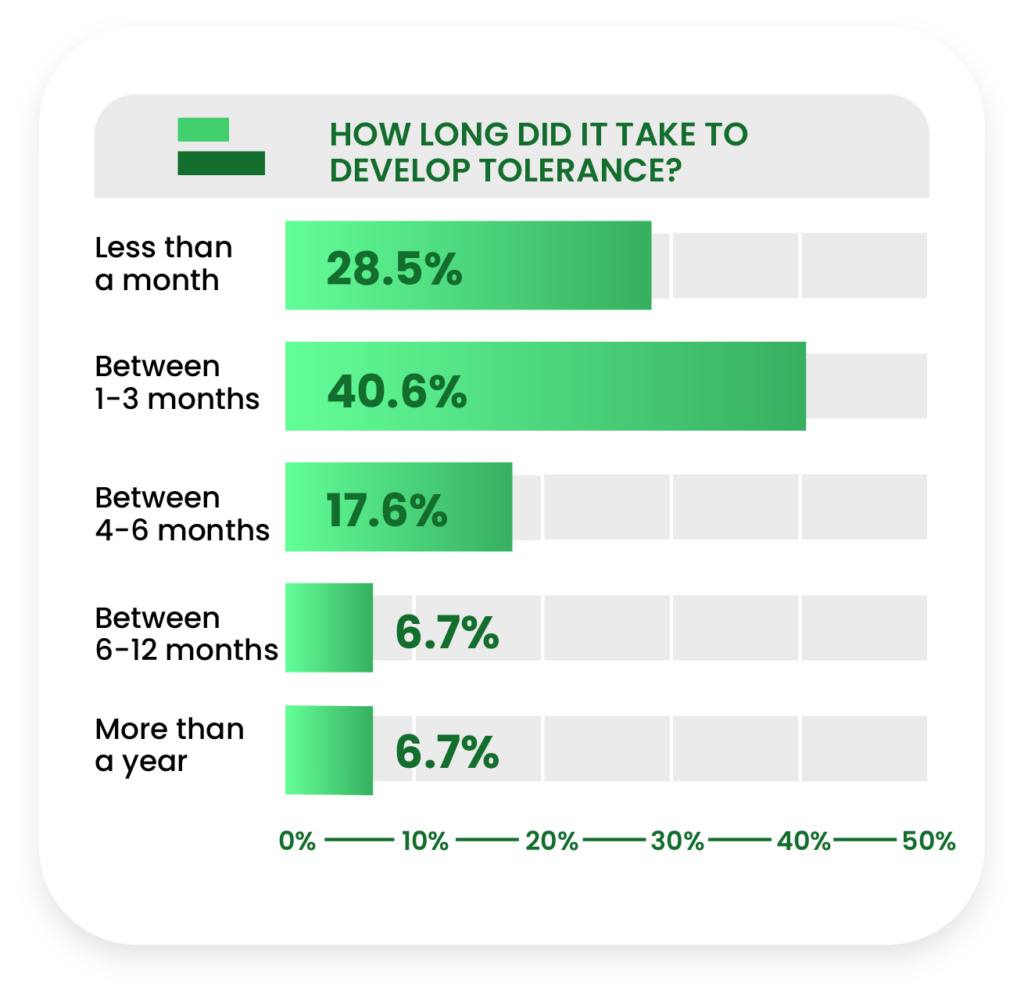
Among those who did notice a tolerance, it most often took between 1-3 months (40.6%) or less than a month (28.5%) to develop.
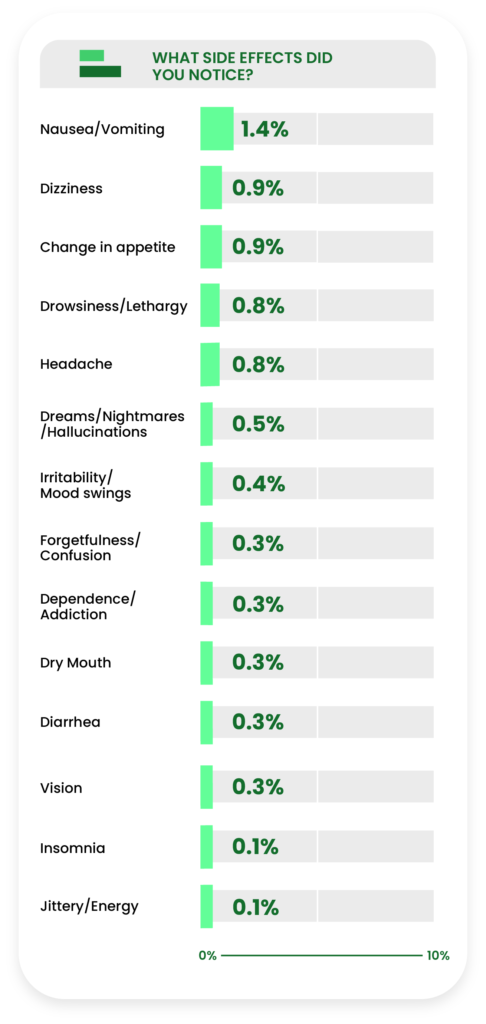
Among those who did notice side effects, the five most common issues reported were nausea and vomiting (1.4%), dizziness (0.9%), changes in appetite (0.9%), drowsiness (0.8%), and headache (0.8%).
Like the side effects reported by current consumers, the majority of past consumers experienced mild side effects.
Potential Consumers
All of the data in this section refer only to the group of customers who have not yet tried CBD, but would consider using it at some point in the future.
This potential consumer group is the largest among our four consumer subgroups, accounting for 35.6% of the eligible respondent pool.
As usual, we’ll introduce this group with a look at demographics.
Demographics
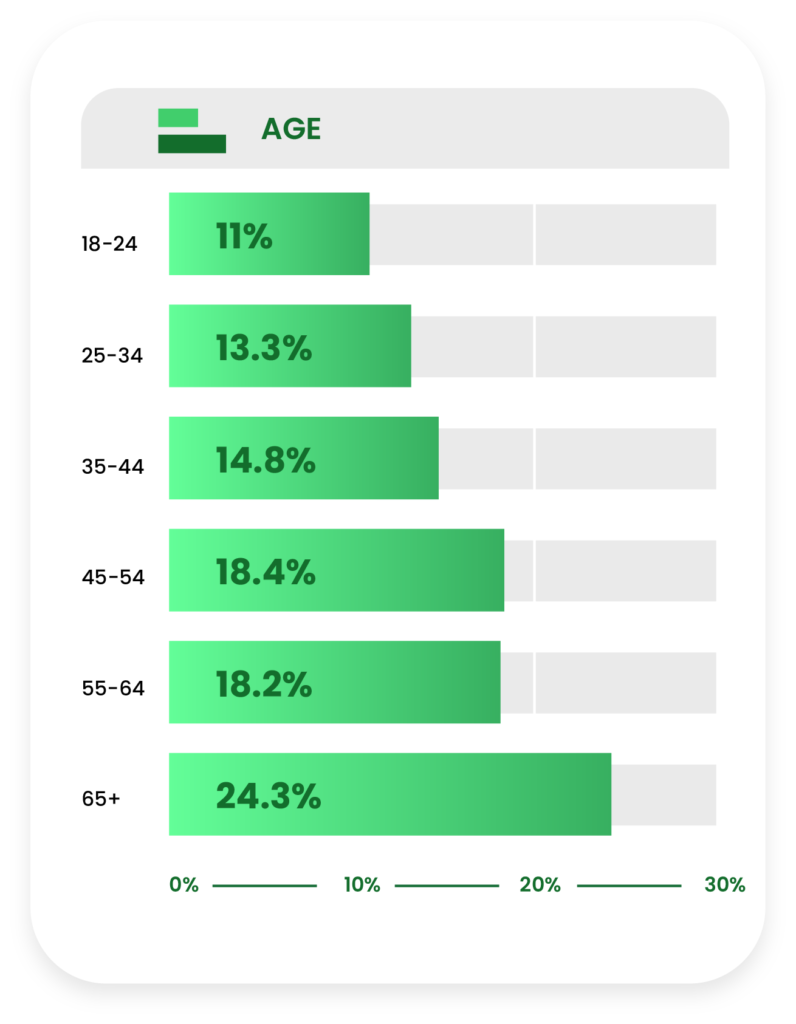
Three in five potential consumers (60.9%) are 45 years of age or older, skewing slightly older than the total eligible respondent pool.
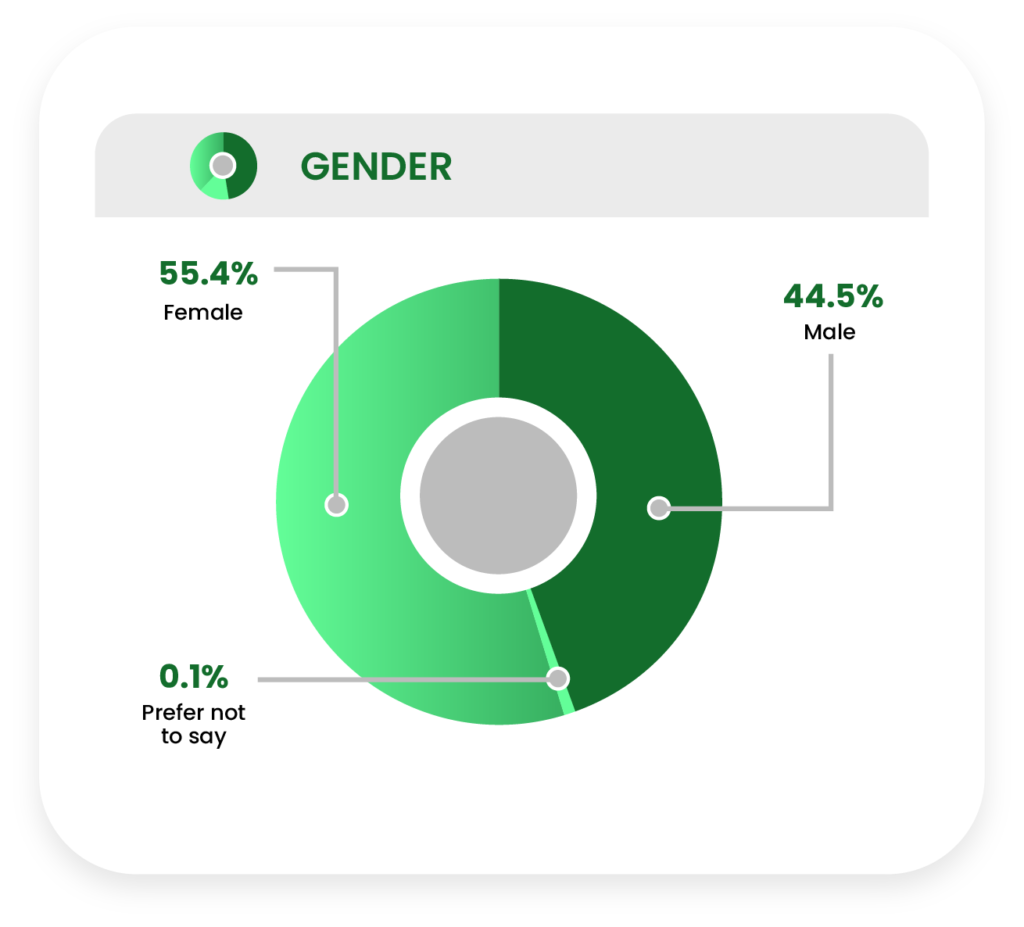
The gender gap was higher in this group than the overall respondent pool, with 55.4% female and 44.5% male respondents.
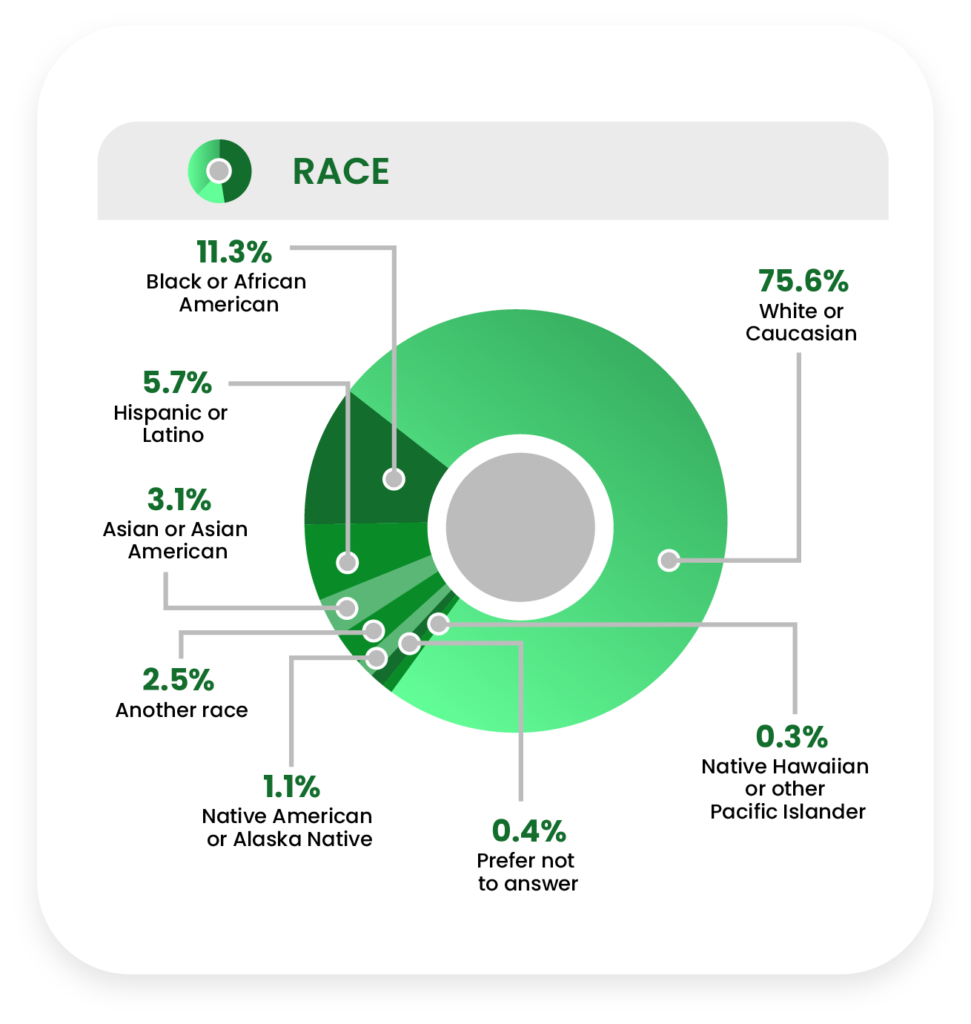
Just over three quarters (75.6%) of potential consumers are White or Caucasian, followed by Black or African American (11.3%), Hispanic or Latino (5.7%), and Asian or Asian American (3.1%).
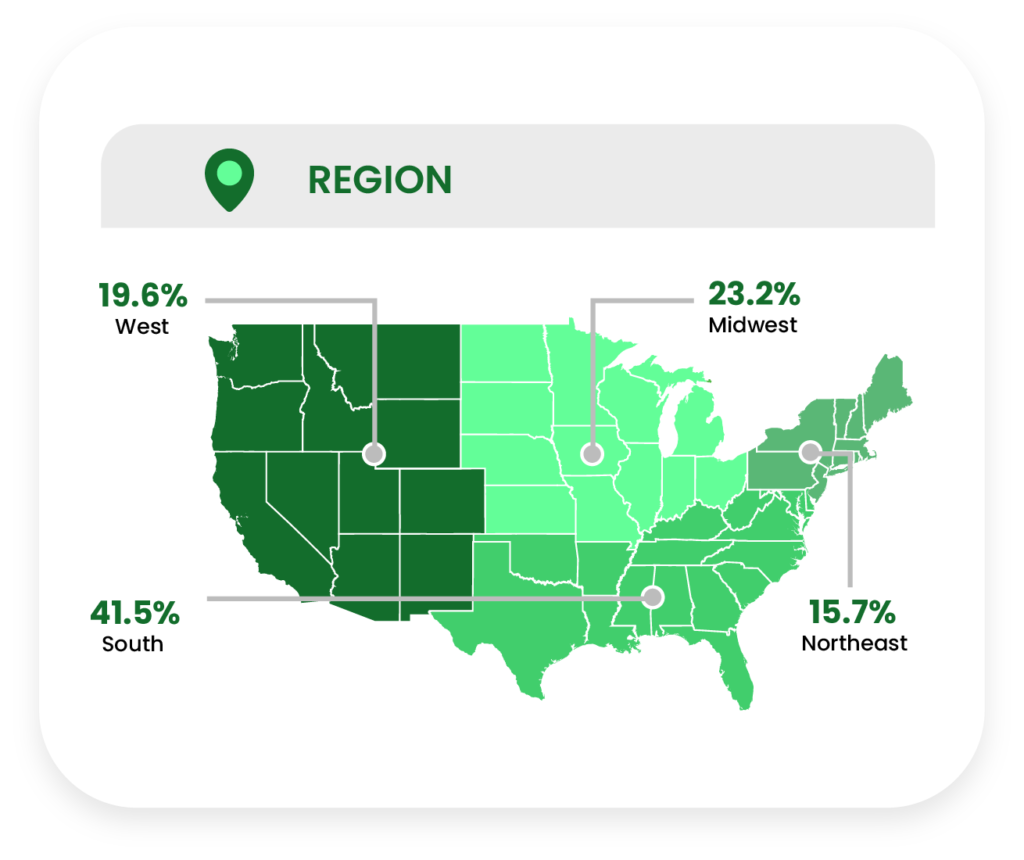
Just under a fifth of potential consumers are from the Western United States (19.6%), as compared to the South (41.5%), Midwest (23.2%), and Northeast (15.7%) regions.
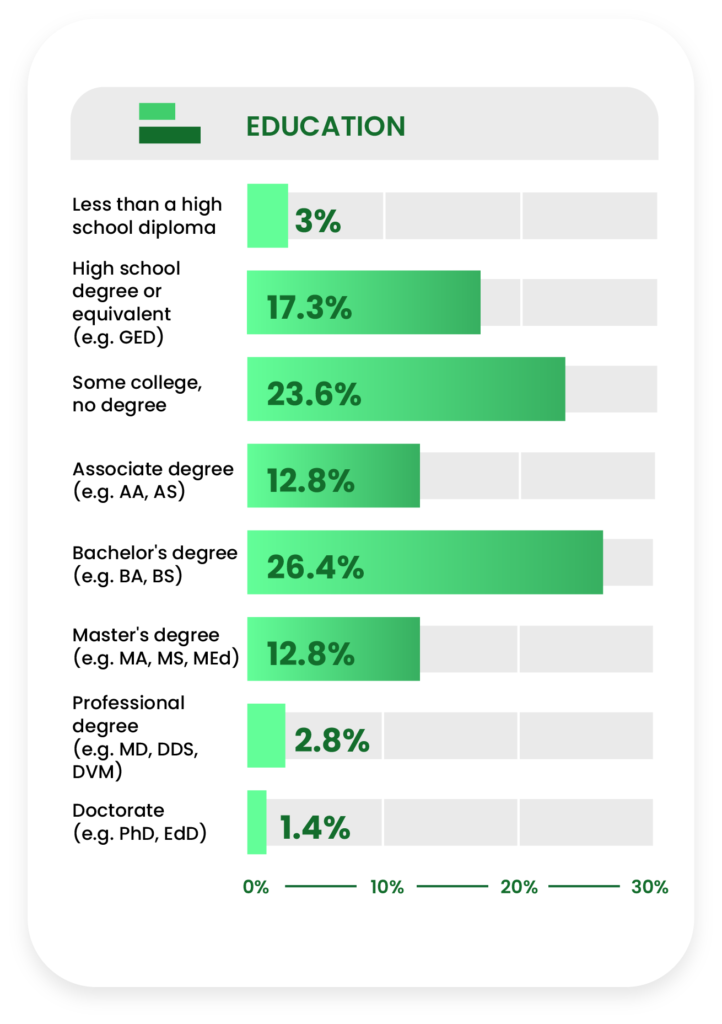
More than two in five potential consumers (43.9%) did not have a college degree, slightly fewer than the overall sample.
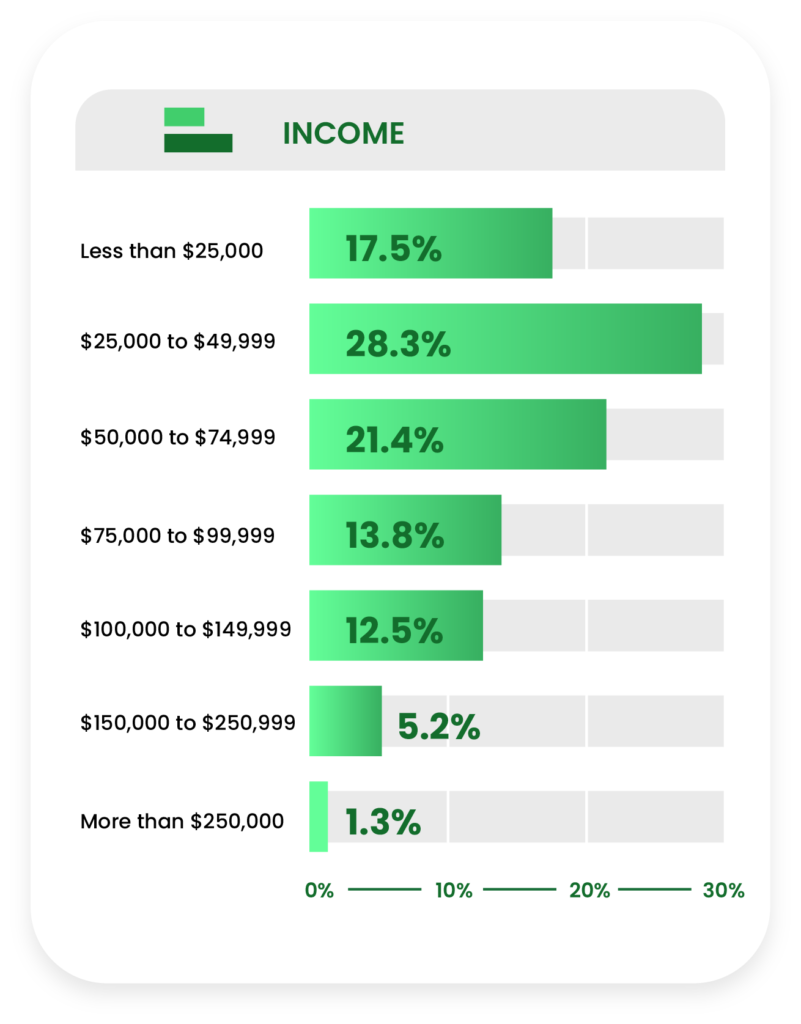
Identically to the overall respondent pool, about two-thirds of potential consumers (67.2%) earn less than $75,000 in annual household income.
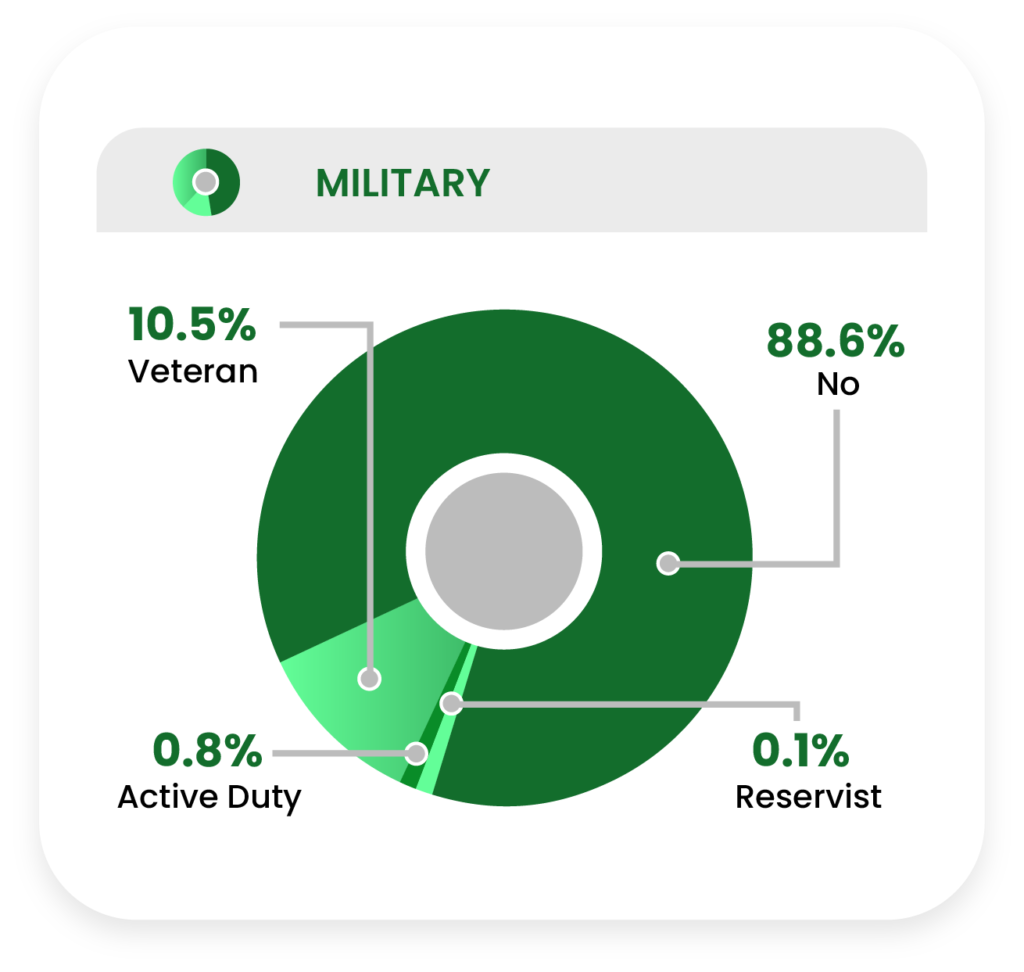
More than one in ten potential consumers (11.4%) said they were associated with the military.
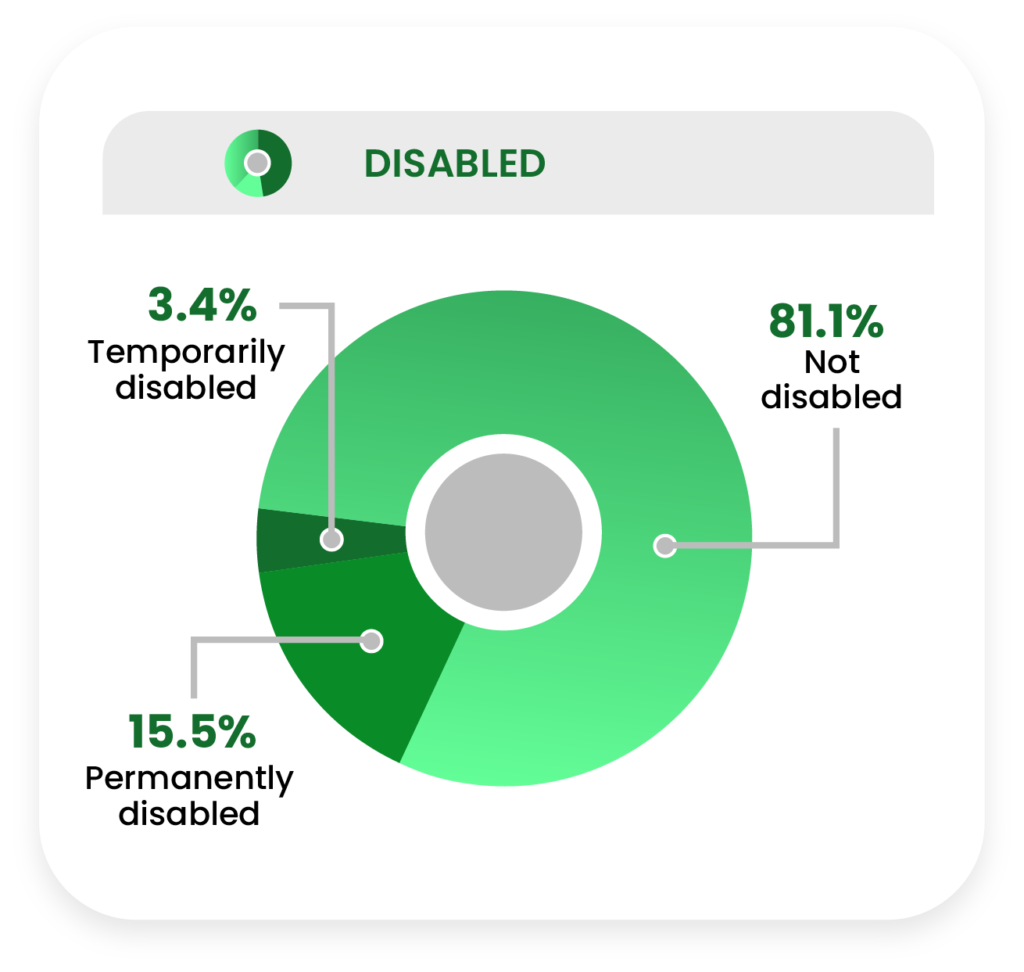
Almost one in five potential CBD users (18.9%) reported being temporarily or permanently disabled.
Reasons They Haven’t Tried CBD
We surveyed potential consumers about the reasons they have not tried CBD, including their single most important reason.
If they were concerned about drug testing, in particular, we followed up about their concern.
The potential consumer group was a telling indicator of the vast knowledge gaps that still cloud the issues of CBD’s safety and effectiveness.
Respondents provided somewhat predictable answers about why they haven’t used CBD; however, their reasoning is noticeably different than that of uninterested consumers.
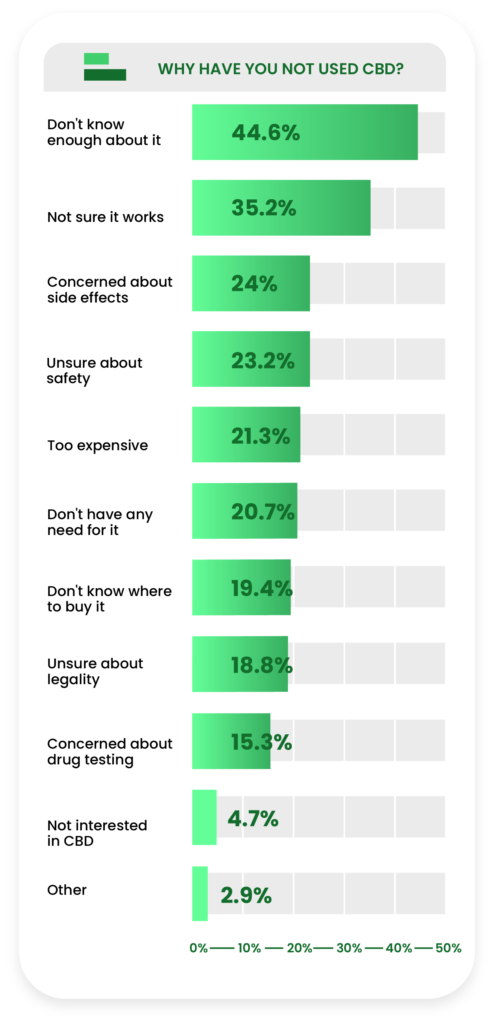
Not knowing enough about CBD was the most popular reason (44.6%) that potential consumers chose to explain why they haven’t tried CBD products yet, followed by “not sure if it works” (35.2%).
These findings very closely match data from our previous report, in which 45.5% of potential consumers stated they didn’t know enough about CBD to try it.
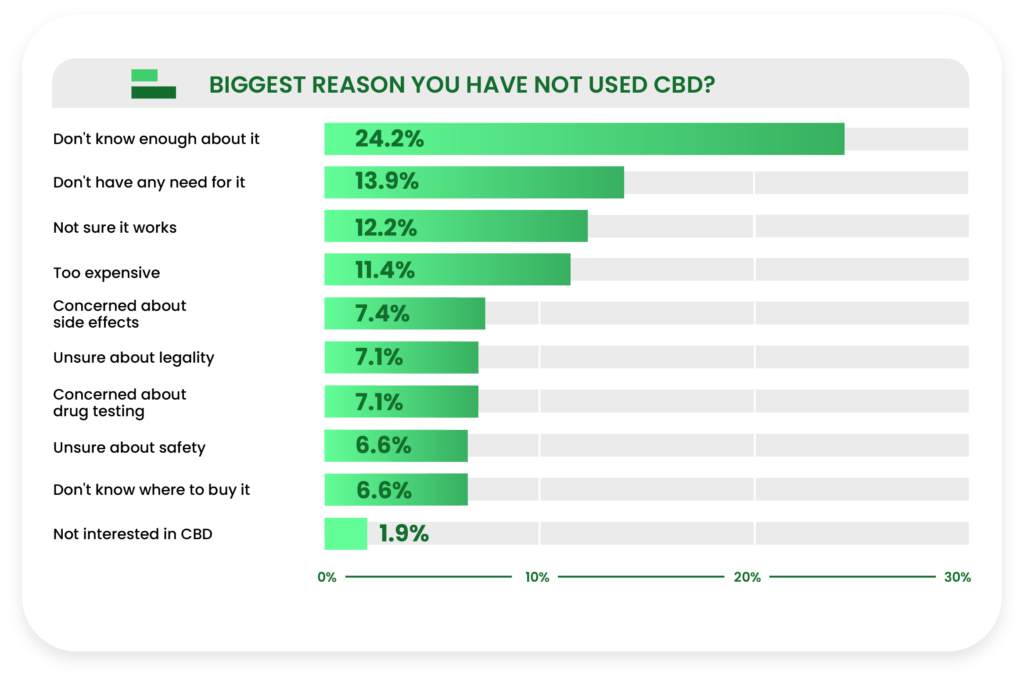
When asked to select the single most important reason they haven’t tried CBD, respondents doubled down, stating they didn’t know enough (24.2%) about the compound.
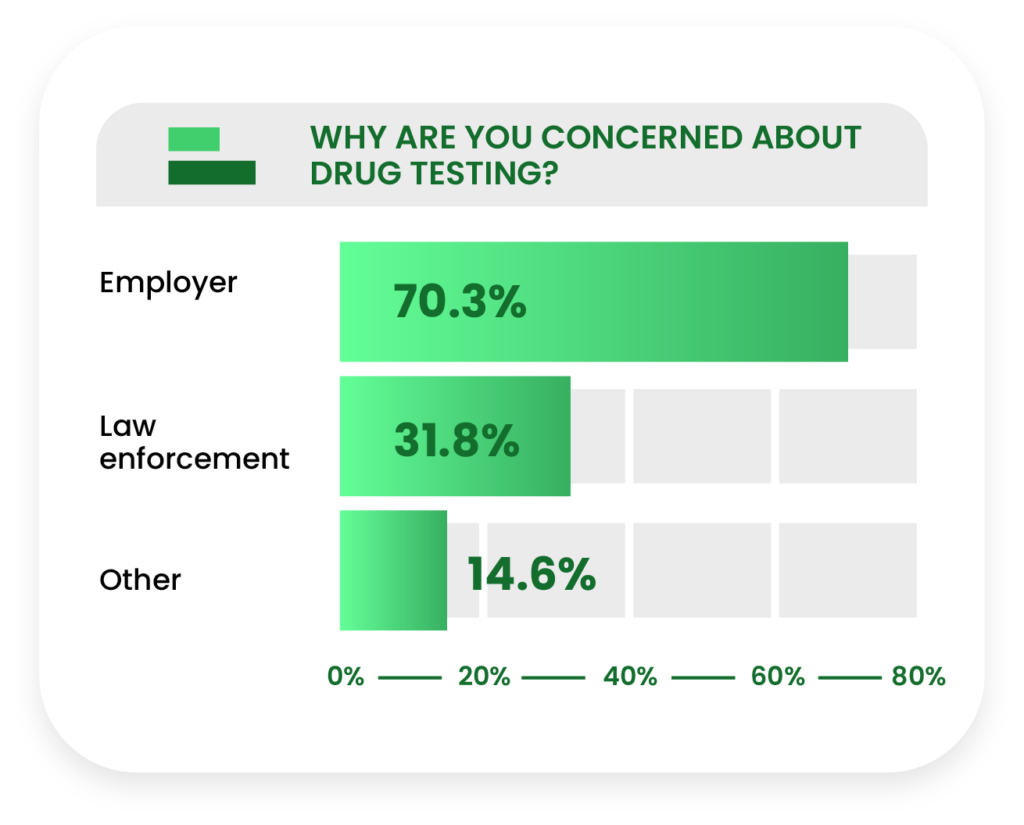
Among the 15.3% of potential consumers who said concerns about drug testing was one reason why they hadn’t tried CBD yet, 70.3% said they feared their employment would be in jeopardy.
Reasons They May Try CBD
We asked potential consumers about how likely they were to begin taking CBD in the next six months.
Respondents also told us the potential reasons that would lead them to using CBD in the future.
We found interesting disparities between age groups for the reasons potential consumers provided.
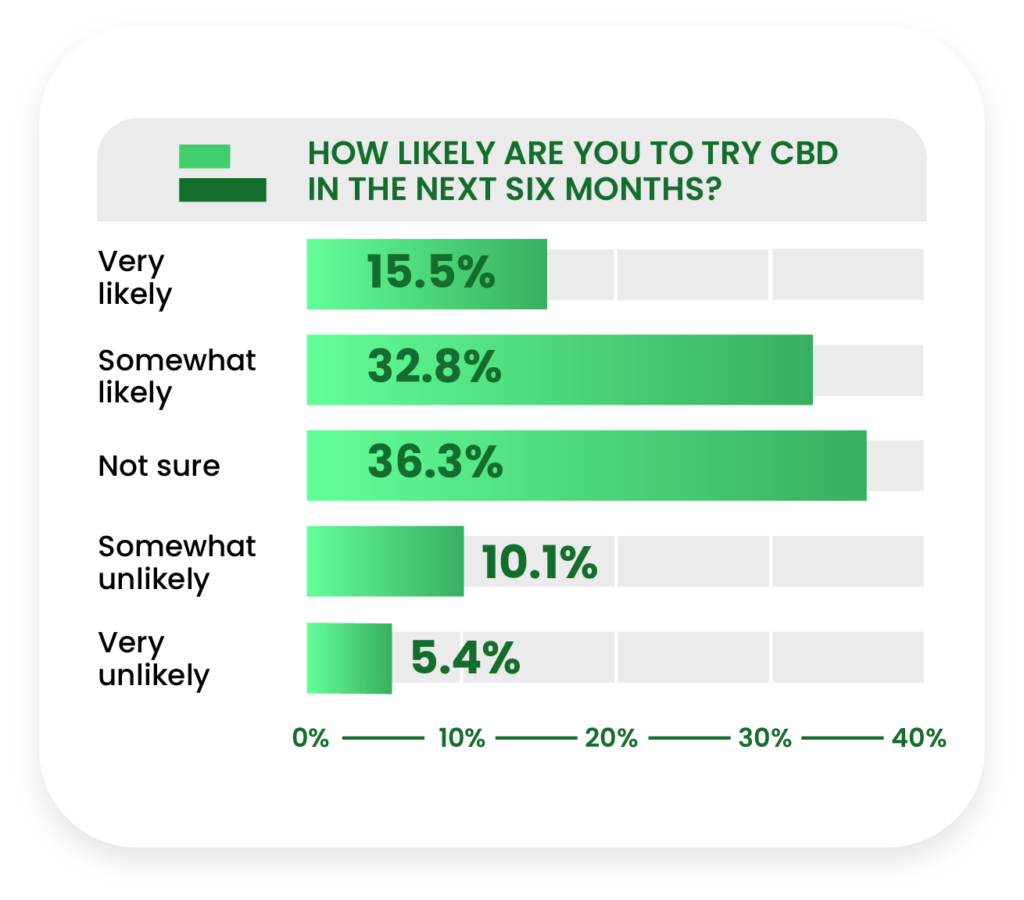
A combined 48.3% of potential consumers said they were likely to some degree to try CBD in the next six months versus 15.5% who said they were unlikely. However, more than a third (36.3%) said they were “not sure.”
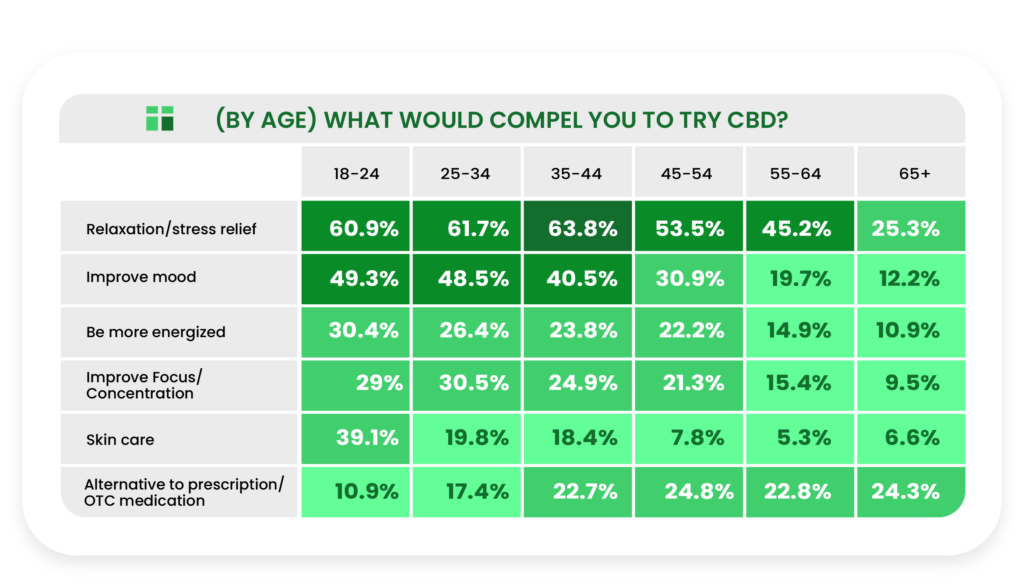
Interestingly, there was a negative correlation with age for reasons such as “relaxation/stress relief,” “improve mood,” and “skin care”; however, there was a positive correlation for “alternative to prescription/OTC medication.”
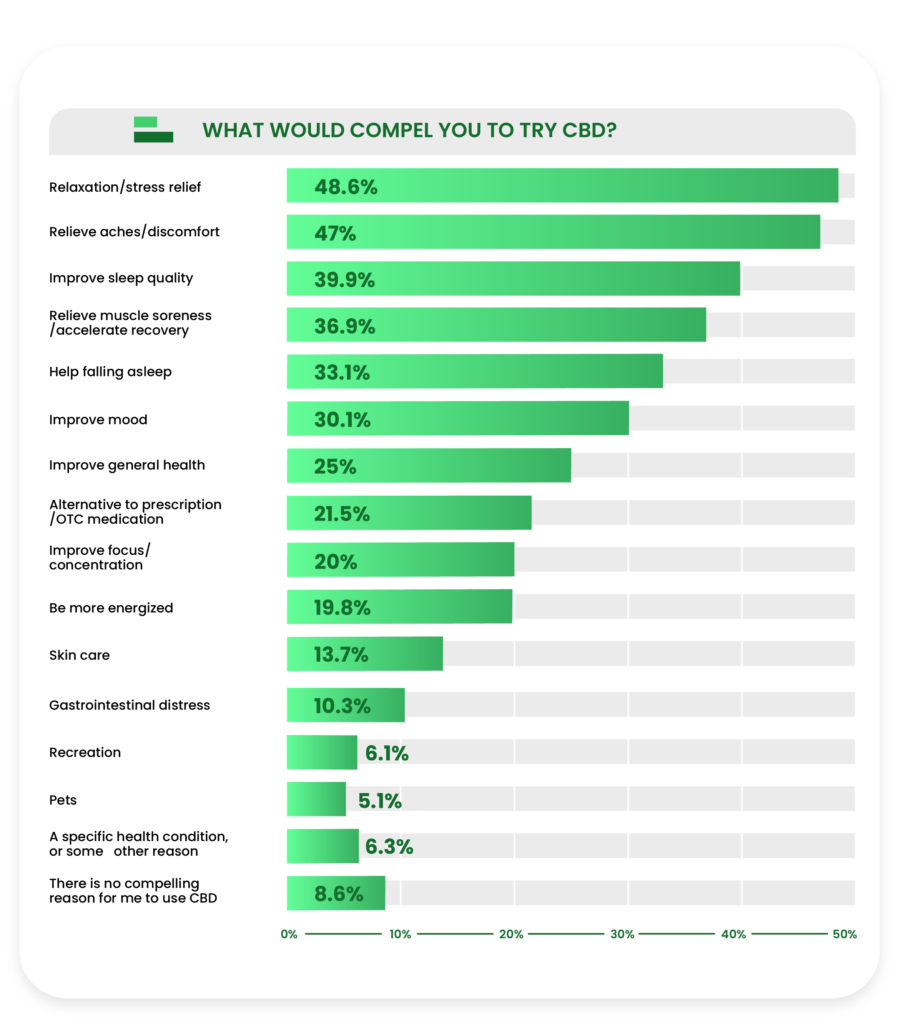
The most compelling reasons for potential consumers to take CBD were relaxation/stress relief (48.6%) and relieving aches/discomfort (47%).
Uninterested Consumers
This year we gathered data on another segment of CBD consumers in the US population: the uninterested consumer.
All of the data in this section refer only to that group of respondents who stated they had not tried CBD and felt no desire to try it in the future.
Uninterested consumers were the smallest subgroup, comprising 15.7% of the eligible respondent pool.
Let’s begin once more with the demographic breakdown.
Demographics
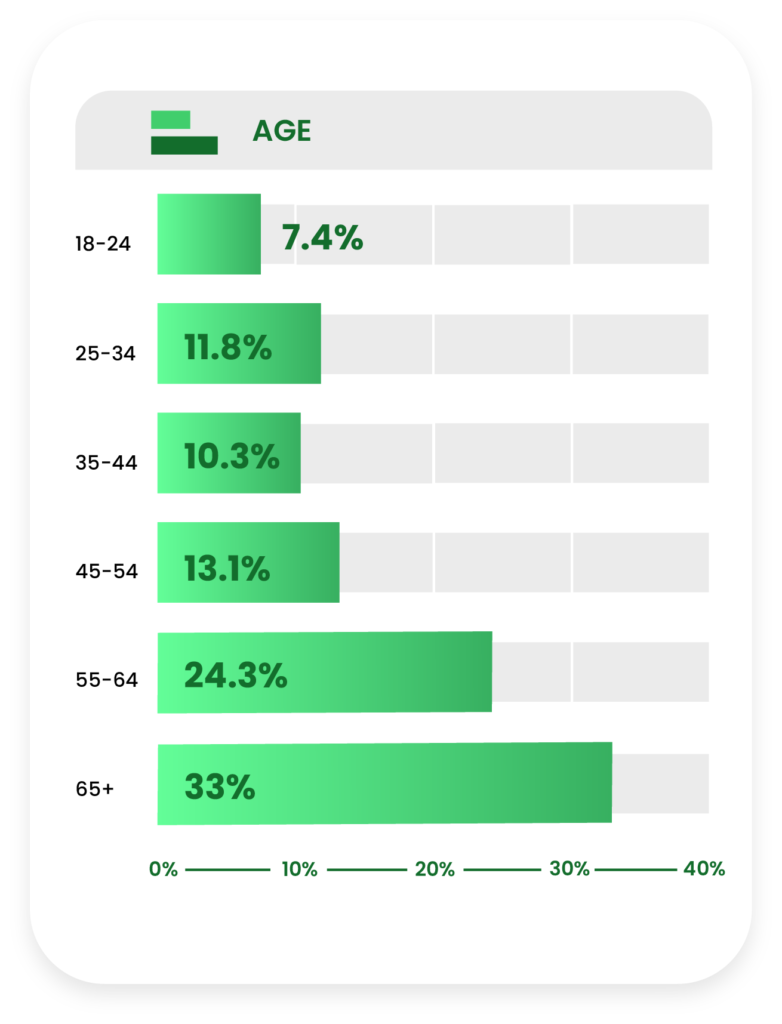
Seven in ten uninterested consumers were 45 years of age or older (70.4%), significantly higher than the eligible respondent pool.
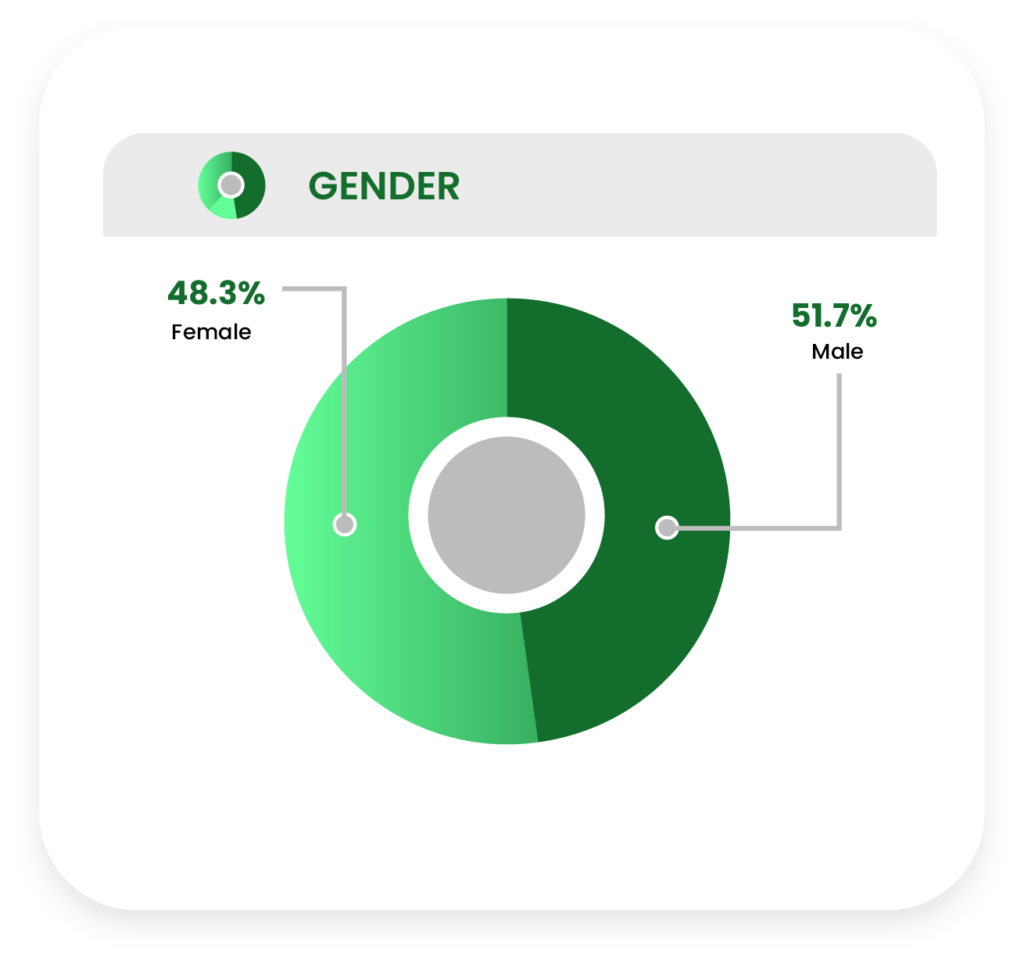
This stance on CBD was apparently the least divisive across the gender line (51.7% males and 48.3% females), and was also the only consumer subgroup with a male majority.
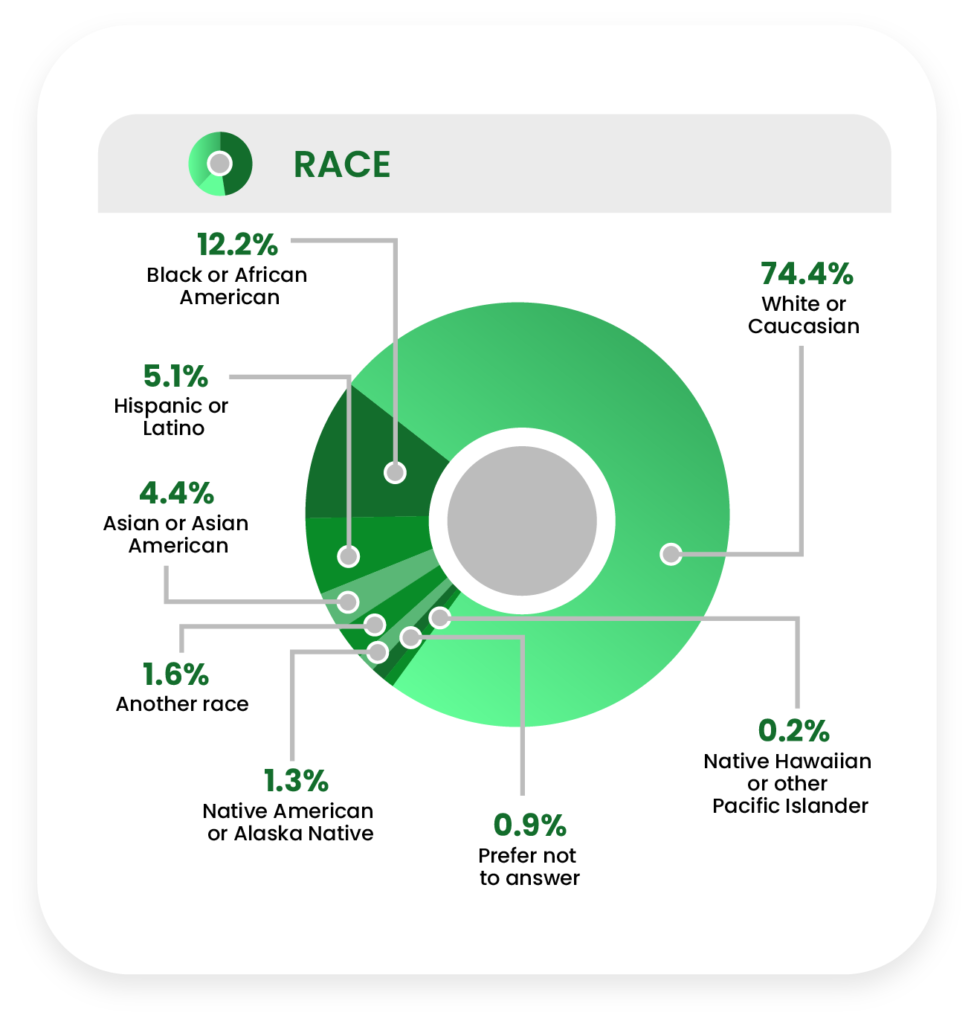
The race distribution was similar to the overall sample with White or Caucasian at 74.4%, Black or African American at 12.2%, Hispanic or Latino at 5.1%, and Asian or Asian American at 4.4%.
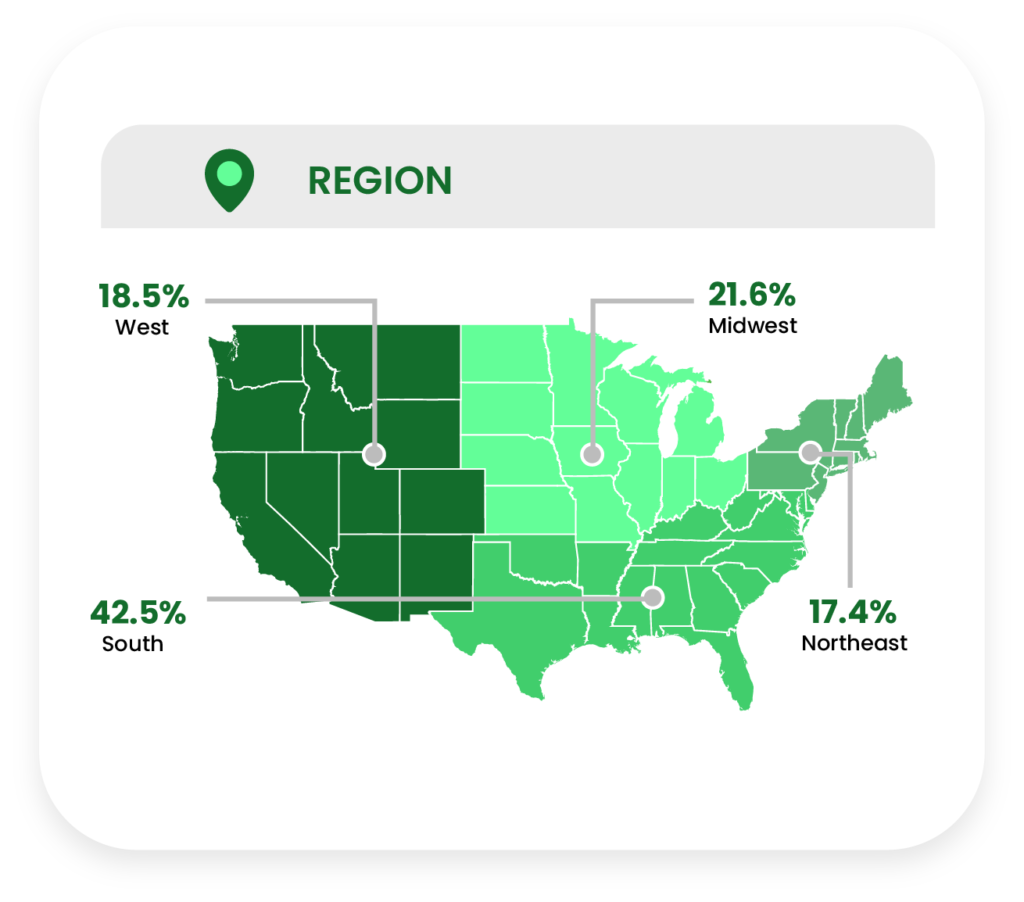
Just under one in five respondents (18.5%) live in the Western United States, as compared to the South (42.5%), Midwest (21.6%), and Northeast (17.4%) regions.
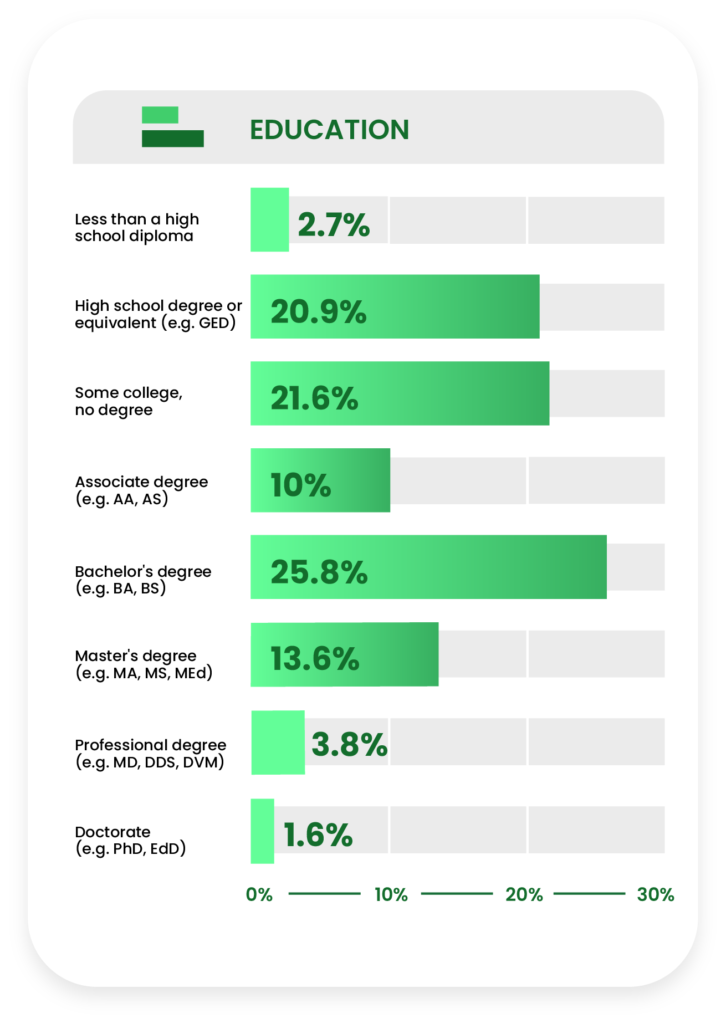
More than two in five uninterested consumers (45.2%) reported not having a college degree, slightly less than the entire eligible respondent pool.
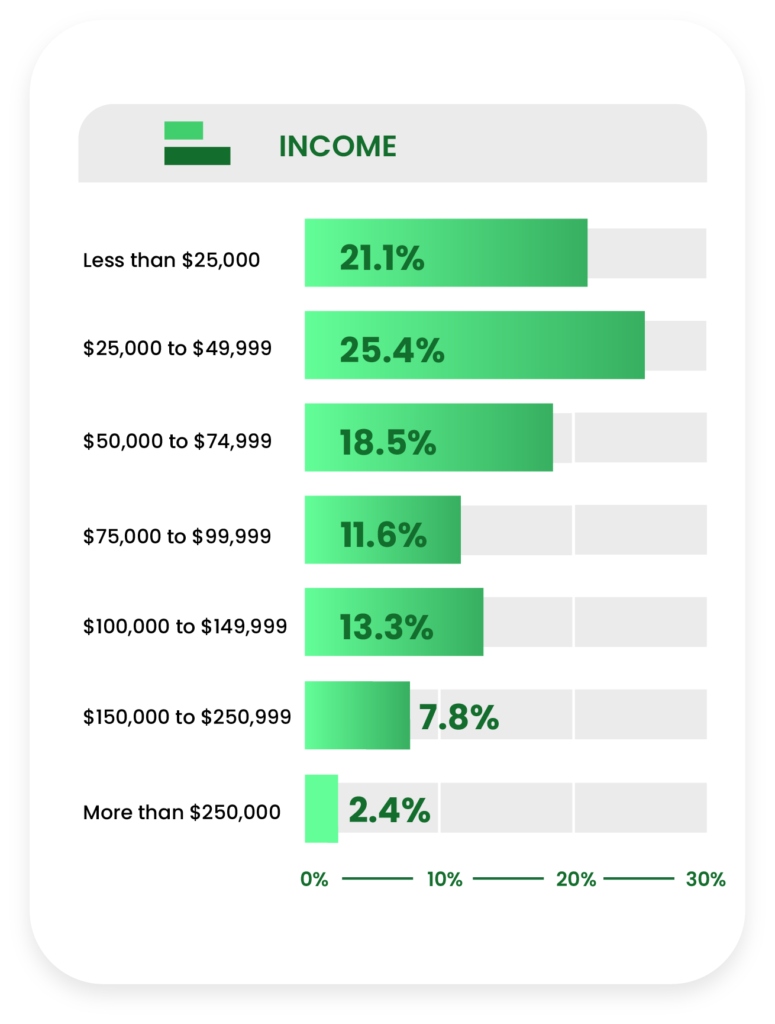
Almost two-thirds of uninterested consumers (65%) earn less than $75,000 in annual household income.
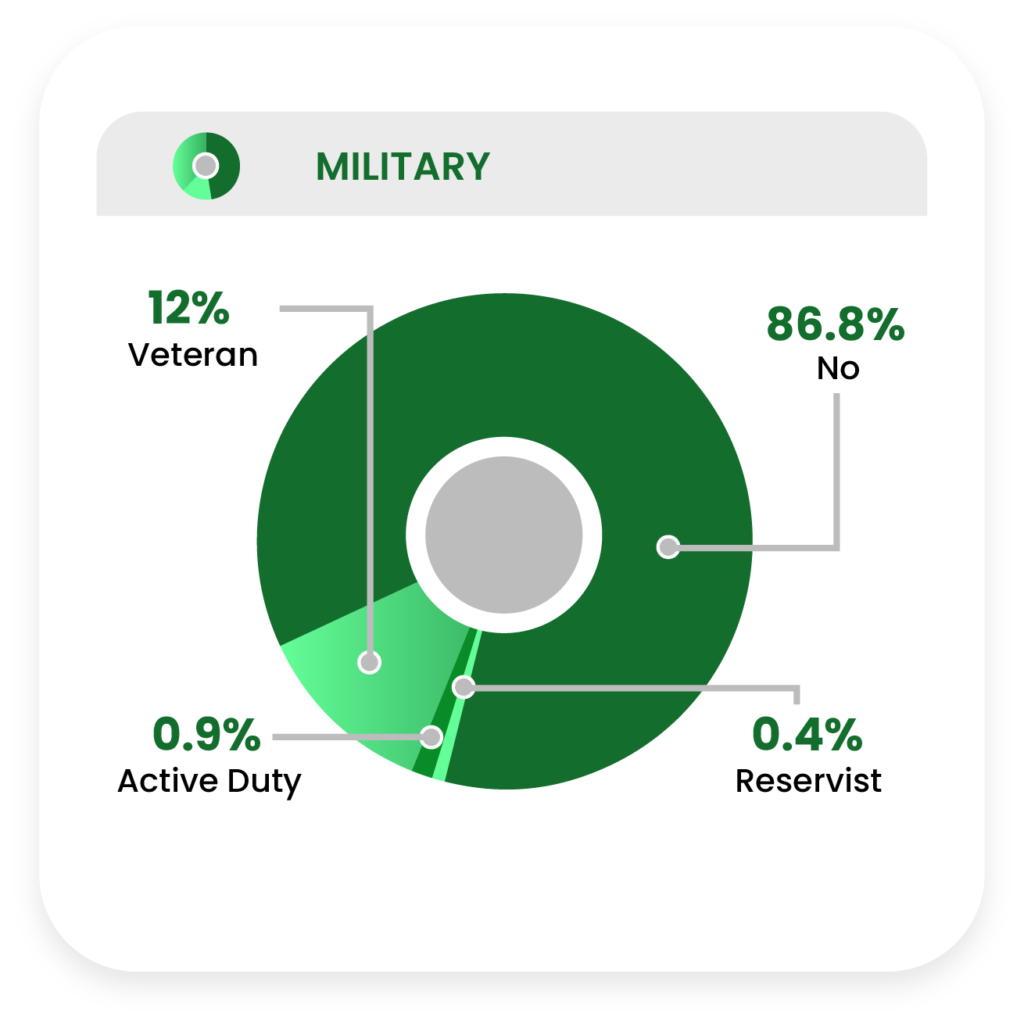
Slightly outpacing the overall sample, 13.3% of uninterested consumers reported being a part of the military to some degree.
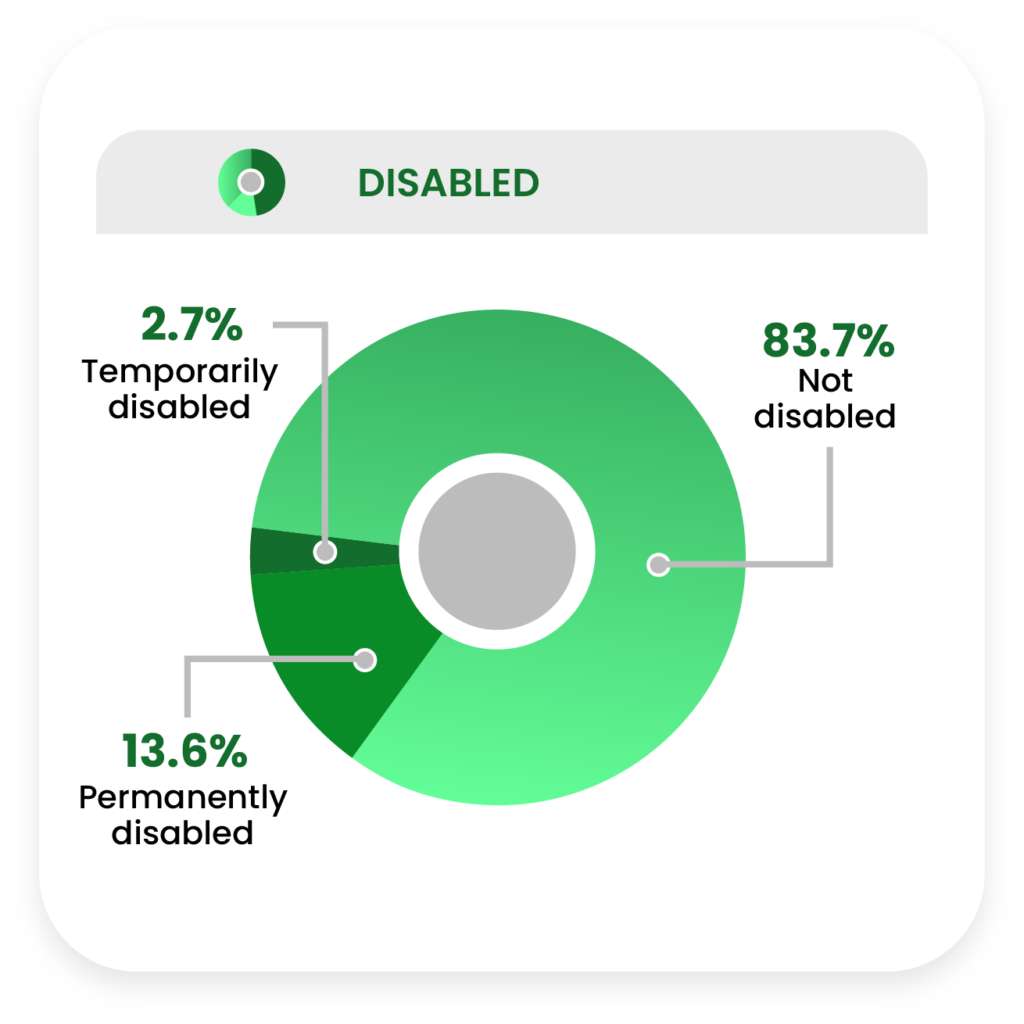
Temporarily and permanently disabled respondents were slightly underrepresented among uninterested consumers (16.3%) compared to our overall sample.
Reasons They Haven’t Tried CBD
We surveyed potential consumers about the reasons they have not tried CBD, including their single most important reason.
In that data, we observed an interesting finding among disabled uninterested consumers.
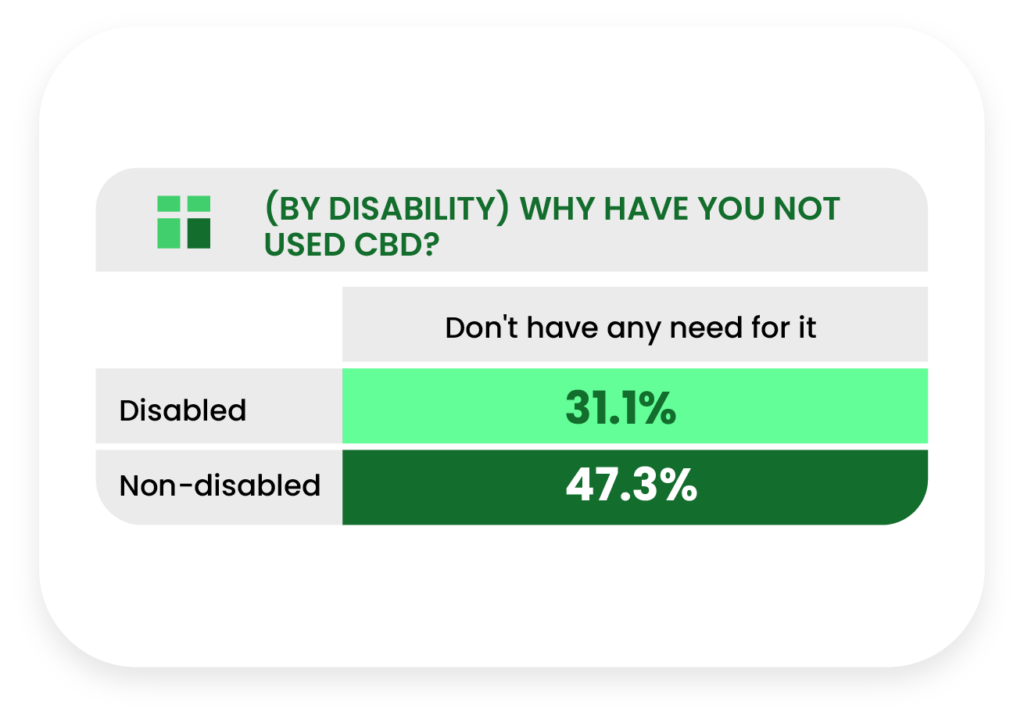
Uninterested consumers who are disabled are significantly less likely to claim that they do not need CBD compared to the rest of the group.
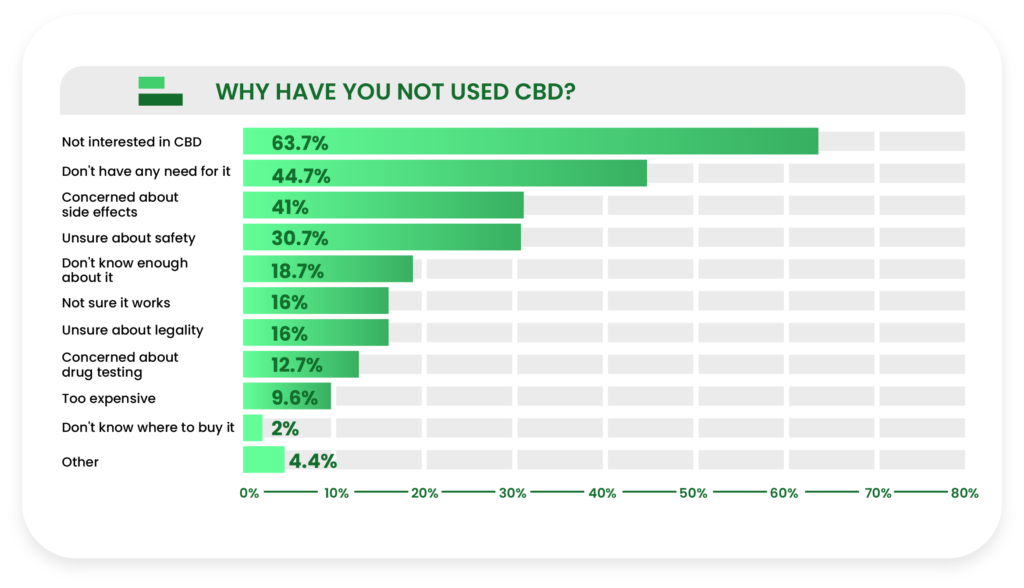
The most frequently selected reasons for not trying CBD among this group of uninterested consumers were “not interested” (63.7%), “don’t have any need for it” (44.7%), and “concerned about side effects” (31%).
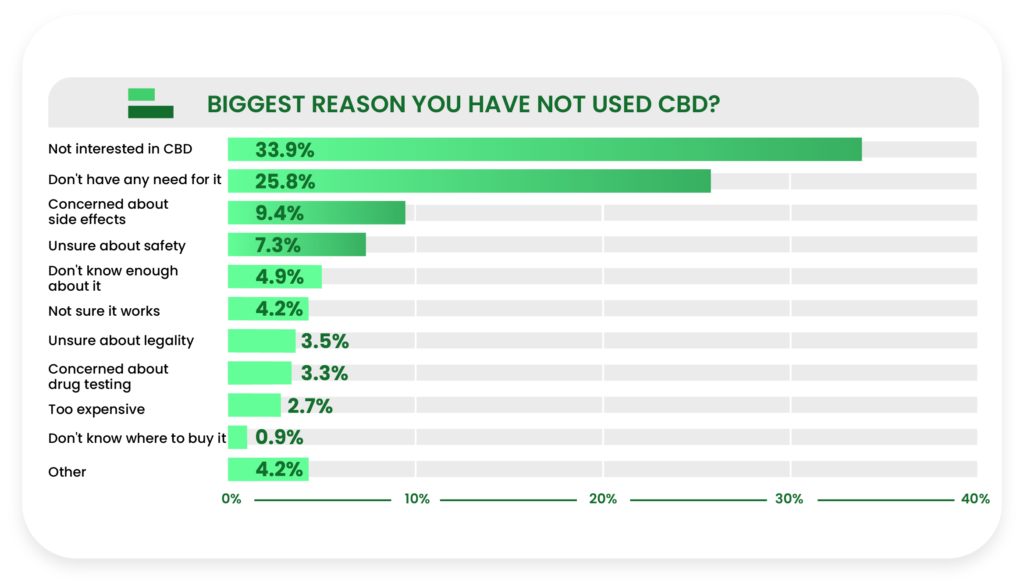
General disinterest (33.9%) persisted as the top response when respondents were asked to pick the single most important reason they have decided not to use CBD, followed once again by “don’t have a need for it” (25.8%).
Reasons They May Try CBD
We asked uninterested consumers about the potential reasons that would lead them to using CBD in the future.
Predictably, the vast majority were not interested at all, indicating that the industry has work to do in educating the public about the potential benefits of CBD. Other responses were significantly split.
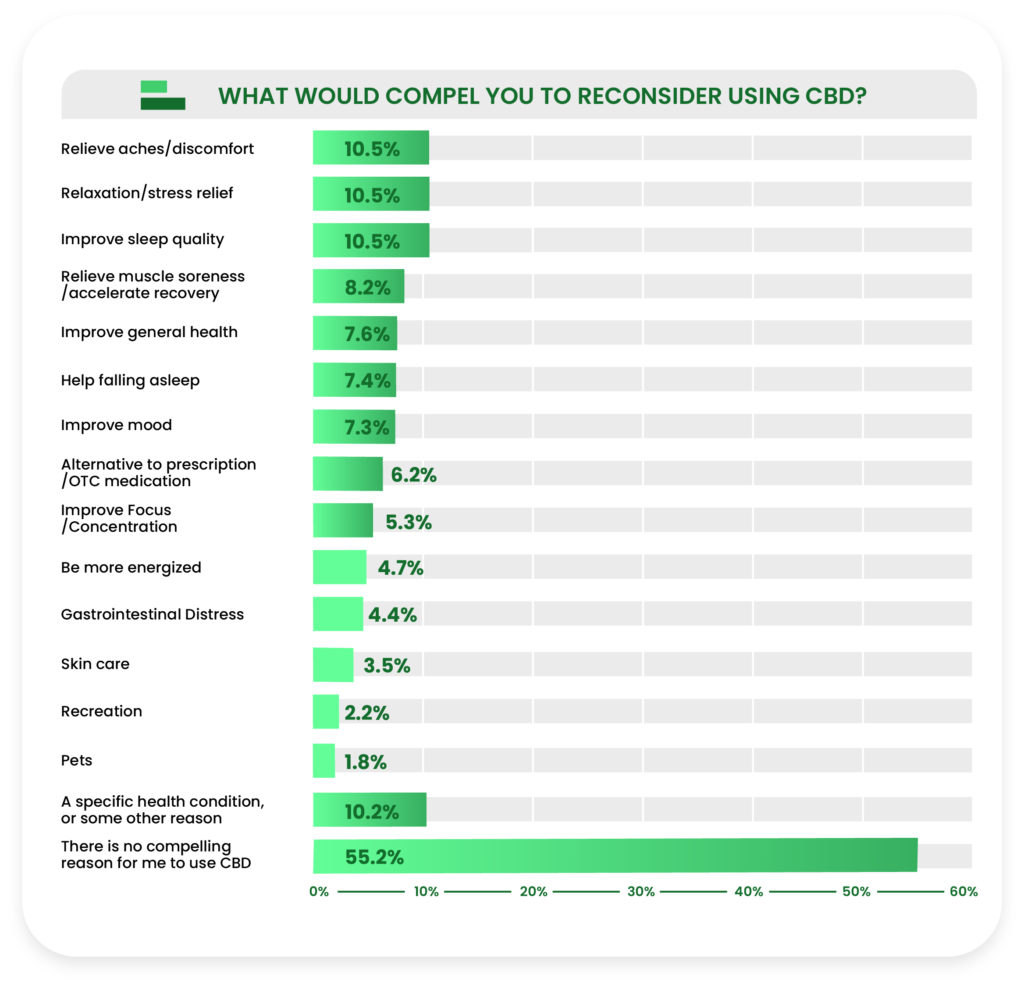
Over half of this audience (55.2%) said there is no compelling reason for them to use CBD, far outpacing the next closest responses (“relieve aches and pains,” “relaxation/stress relief,” and “improve sleep”).
Part Three: Crosstabs
For this portion of the consumer report, we’re going to highlight all of the interesting findings and data trends we found within each of the nine crosstabs (consumer status, age, gender, race, region, education, income, military status, and disability status).
As expected, the respondents’ personal experiences and attitudes towards cannabidiol greatly influenced many of their behaviors and beliefs, so we’ll begin with consumer status.
Note: Some data tables will only display the most interesting findings. Also, data should be assumed to represent all eligible respondents unless stated otherwise.
Consumer Status
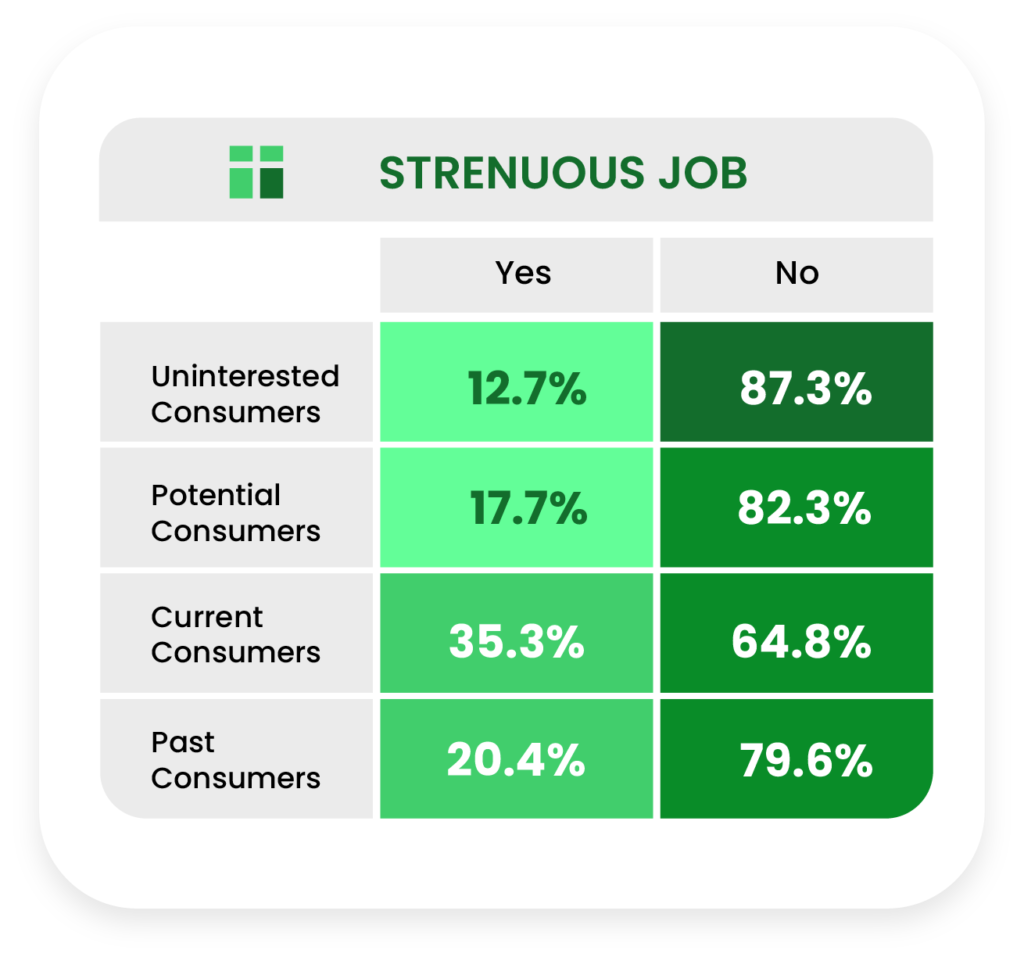
Current CBD users were significantly more likely to have a job that requires strenuous physical activity (35%) than potential (17.7%) and uninterested (12.7%) consumers.
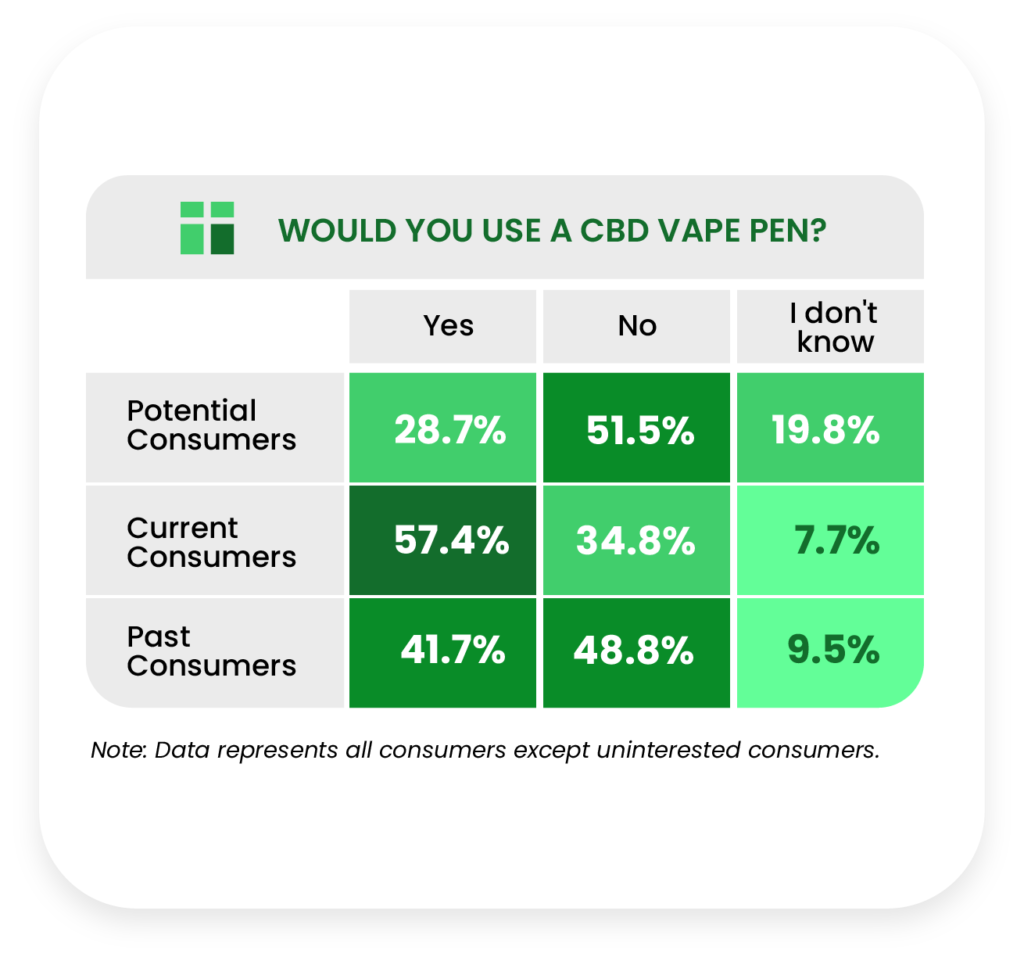
Current consumers were twice as likely to try a CBD vape pen (57.4%) than potential consumers (28.7%).
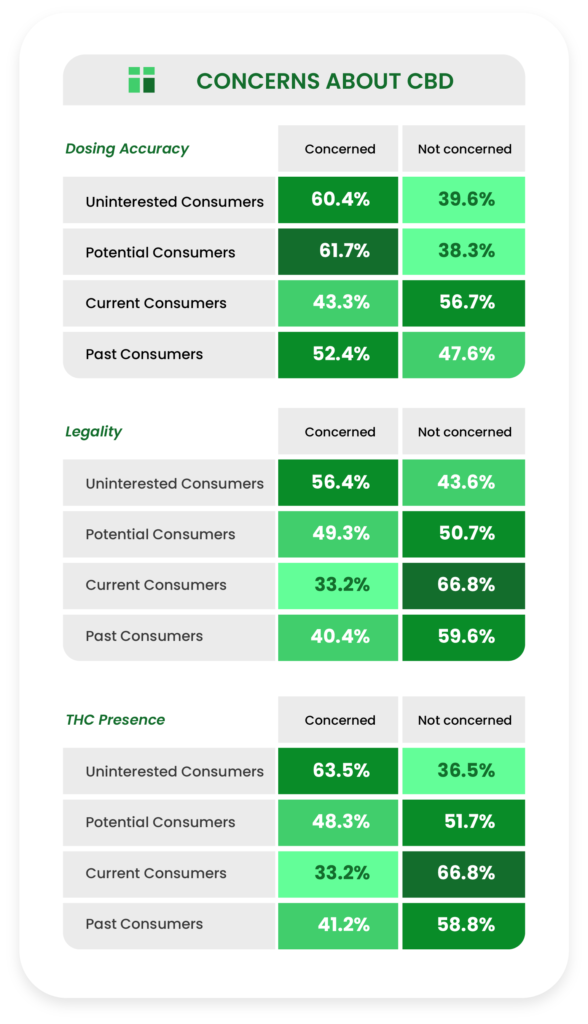
Current users were significantly less concerned (43.3%) about dosing accuracy than potential users (61.7%) and the closely clustered uninterested group (60.4%).
Current CBD users were much less concerned about CBD legality (33.2%) than uninterested respondents (56.4%).
Current consumers were also much less concerned about THC presence (33.2%) than uninterested consumers (63.5%).
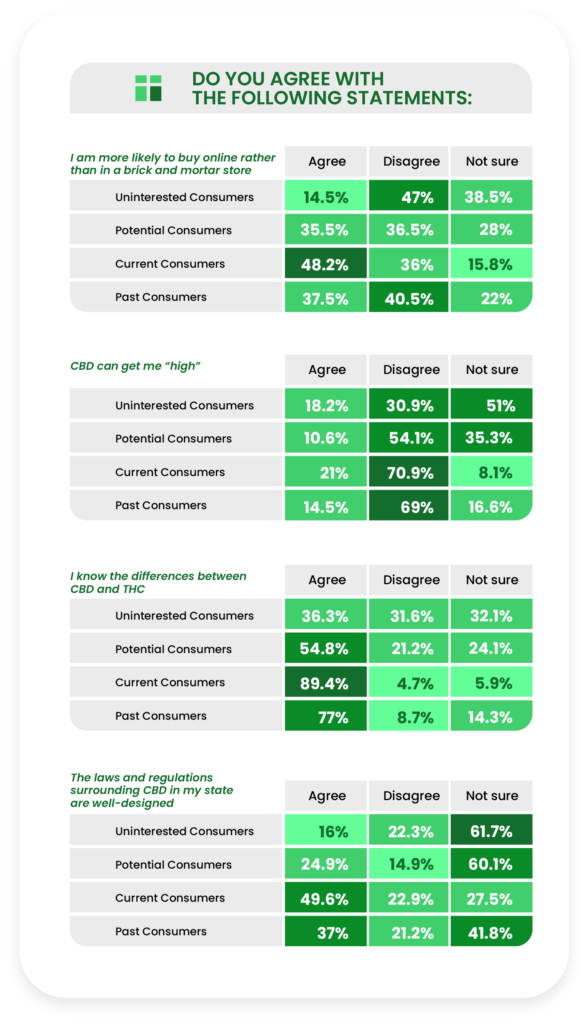
Just over a third (35.5%) of uninterested consumers agreed that they were more
likely to buy CBD online than in a brick-and-mortar store, compared to almost half (48.2%) of current consumers.
Significantly more current and past consumers did not agree that CBD could elicit a “high” compared to uninterested and potential consumers.
A little over half of potential users (54.8%) indicated they knew the difference between CBD and THC, compared to 89.4% of current consumers.
Current CBD users are significantly more likely to agree that the CBD laws in their state are well-designed than uninterested consumers.
Age
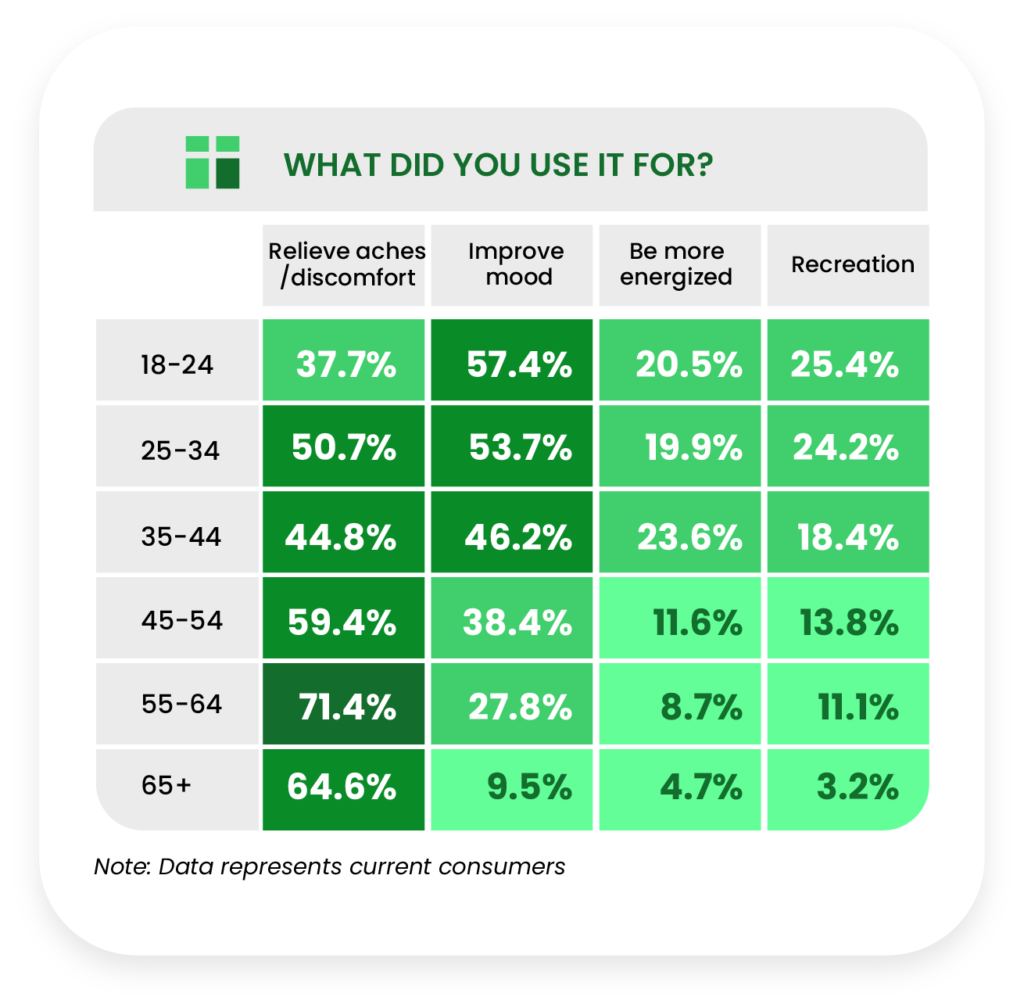
For “relieve aches/discomfort,” the three youngest groups (37.7%-50.7%) were significantly less represented than the three oldest (59.4%-71.4%). For “improve mood,” we observed a strong and consistent downward trend with age. Both findings were similar to our previous report.
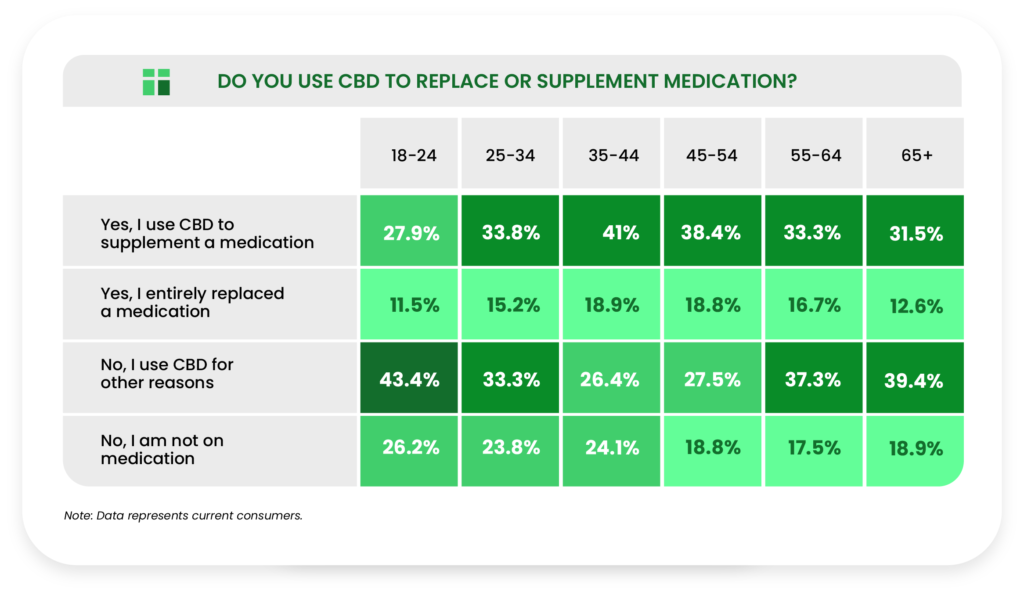
We found interesting bell curve distributions among current consumers who supplemented and replaced a medication with CBD.
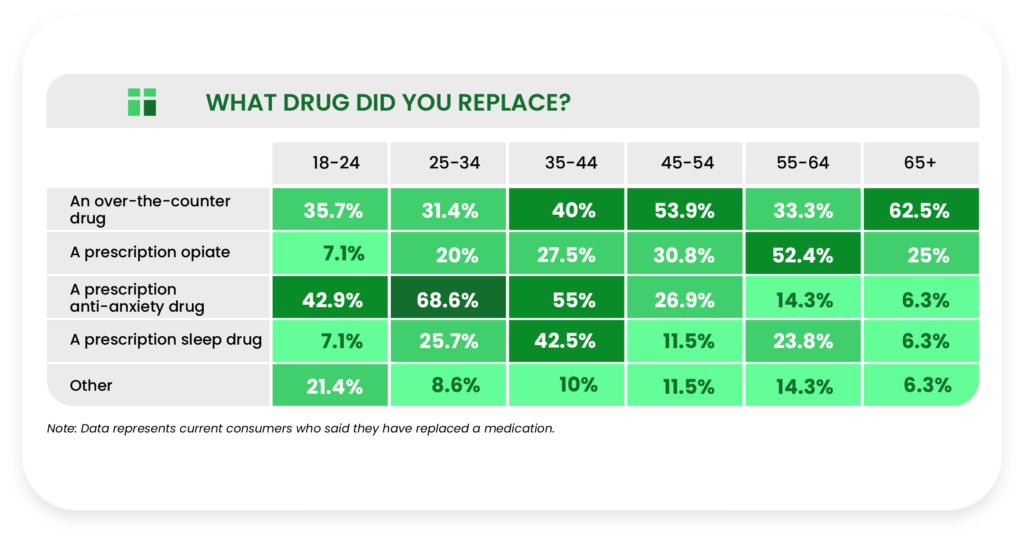
Among current consumers who replaced a medication with CBD, we observed that different age groups were more likely to replace certain medications. For example, the 65+ age group was much more likely to replace an over-the-counter drug (62.5%) than everyone else.
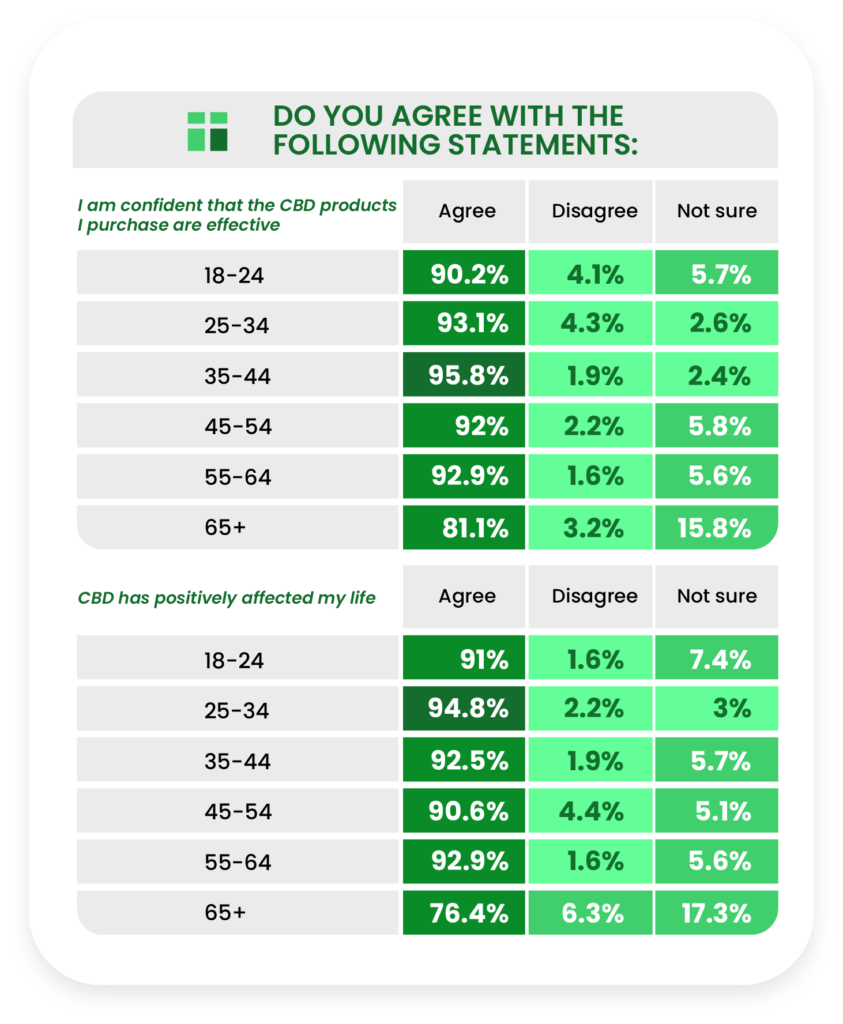
The 65+ age group was significantly less likely to agree that the CBD products they purchase are effective (81.1% vs second lowest 90.2%).
Those 65+ are also less likely to agree that CBD has positively affected their lives (76.4% vs second lowest 90.6%).
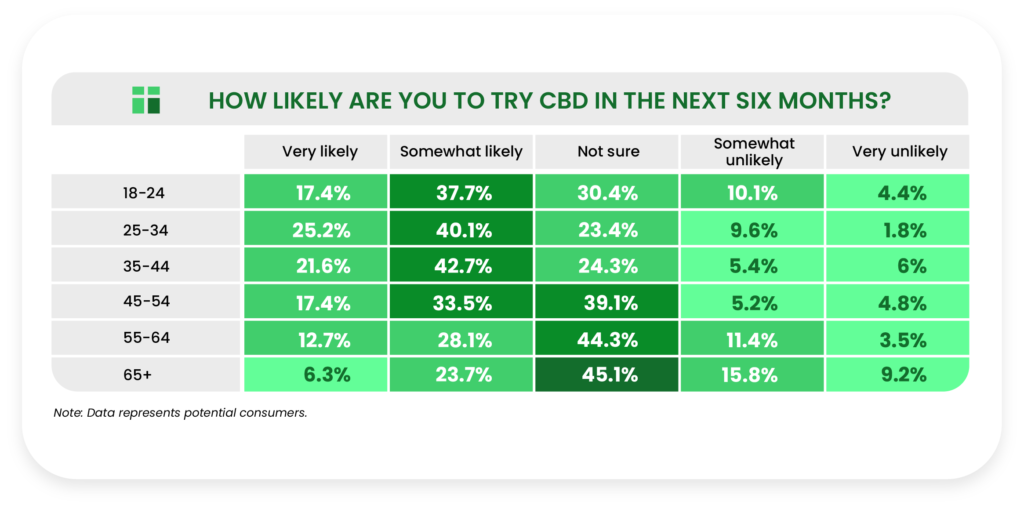
Among potential CBD consumers, at least half of those aged 18-54 said they were very or somewhat likely to try CBD in the next six months. Those 55 and older were significantly more unsure if they would.
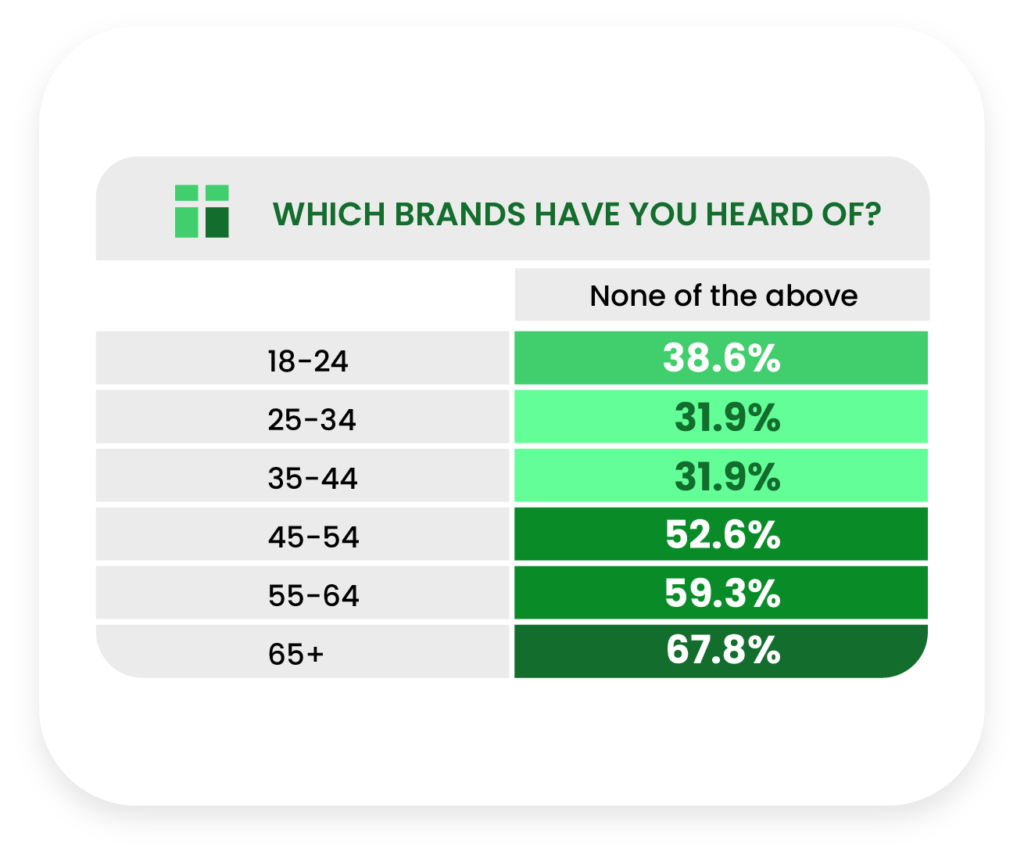
General CBD brand recognition was significantly lower in the older half of respondents, as 52.6-67.8% of older groups said “none of the above,” compared to 31.9%-38.6% of younger respondents.
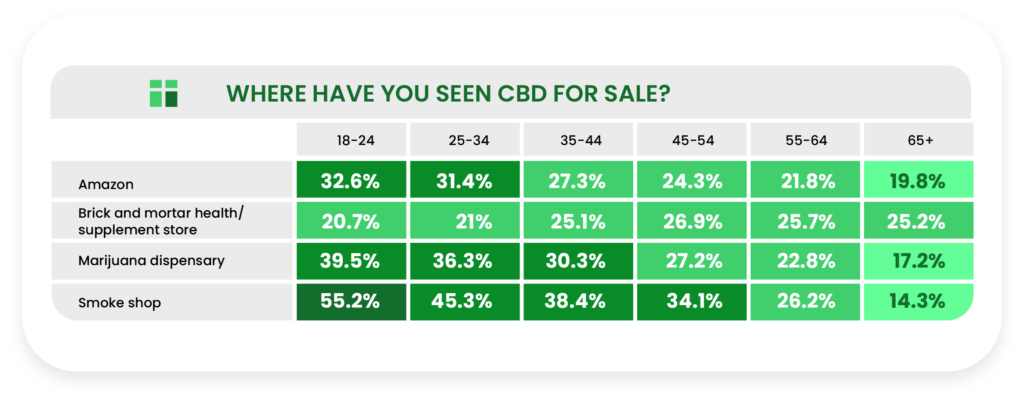
Fewer respondents from the older age groups had seen CBD for sale on Amazon or in marijuana dispensaries; however, older respondents were relatively more likely to see CBD for sale in brick-and-mortar stores.
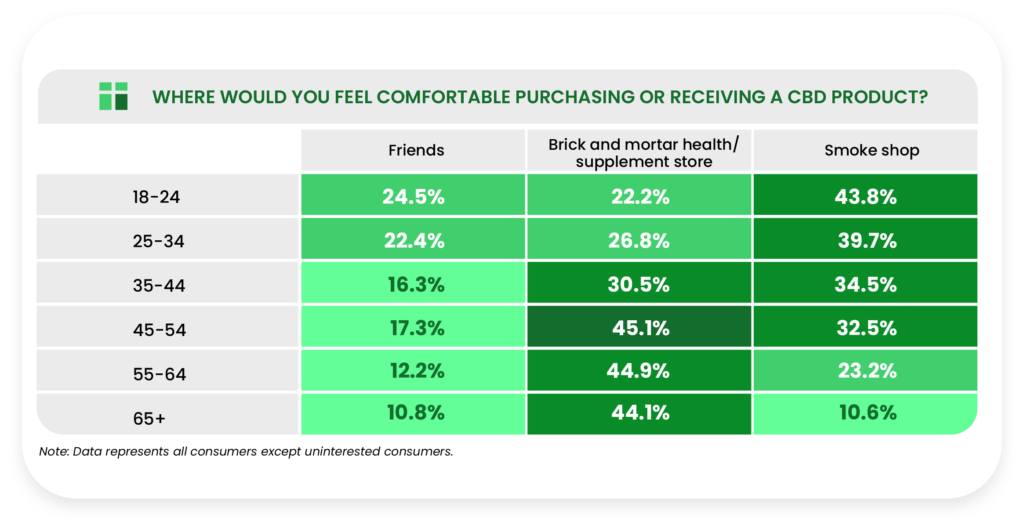
The older half of respondents were more comfortable buying from brick-and-mortar stores than the younger half, a trend we also highlighted in our previous report. Older respondents were less comfortable, however, acquiring CBD from friends and smoke shops.
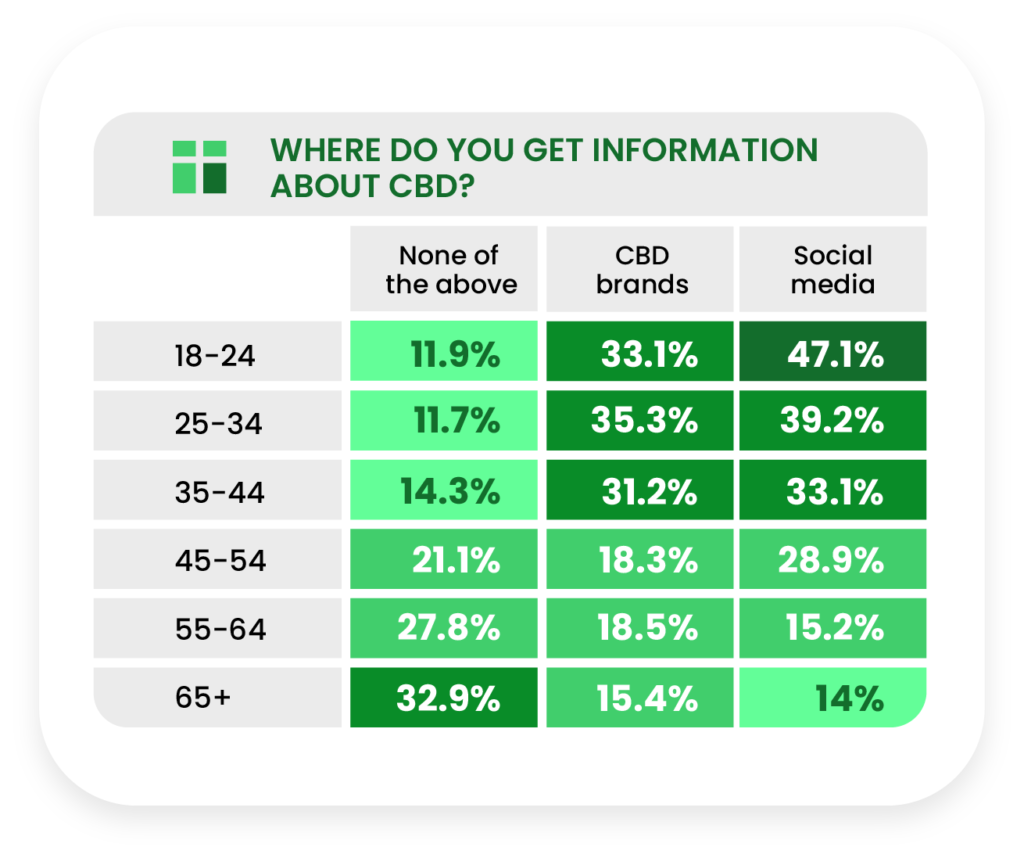
More younger people get information about CBD from social media than older respondents. We also see a sharp divide between young and old when it comes to getting CBD information directly from CBD brands.
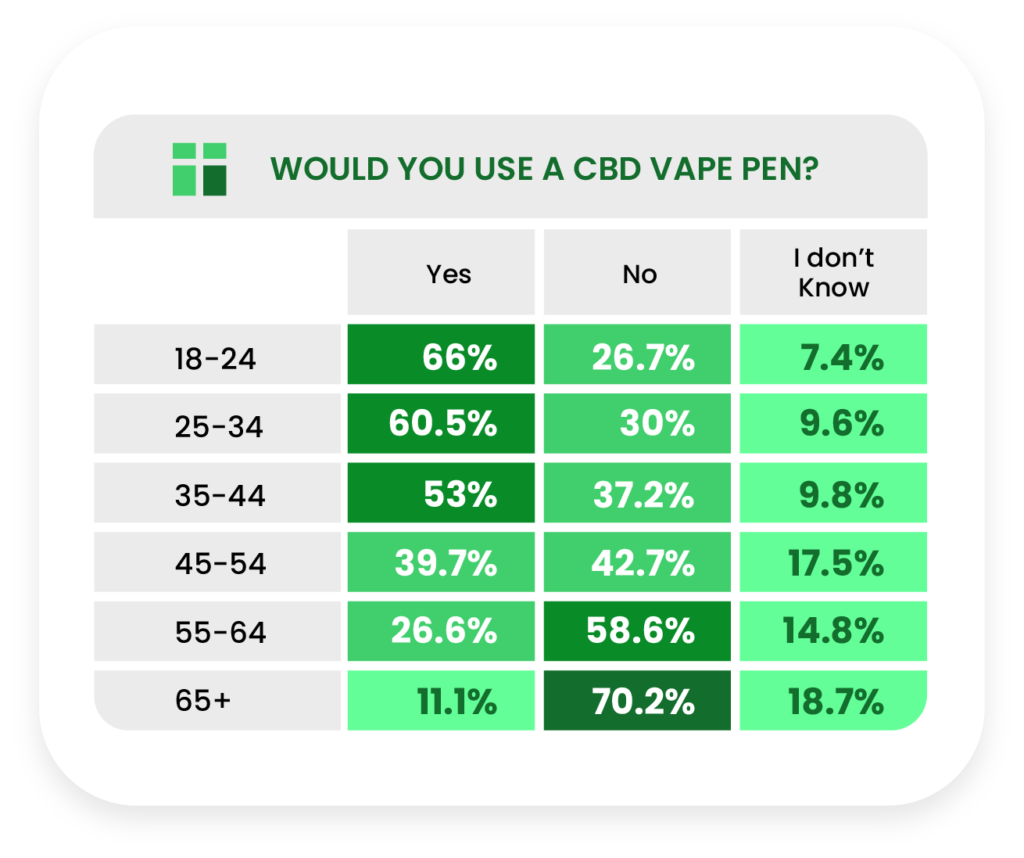
We found a very strong and consistent downward trend across age groups in the area of willingness to use a CBD vape pen, declining from 66% of the 18-24 group who said they would try it to 11.1% of the 65+ group.
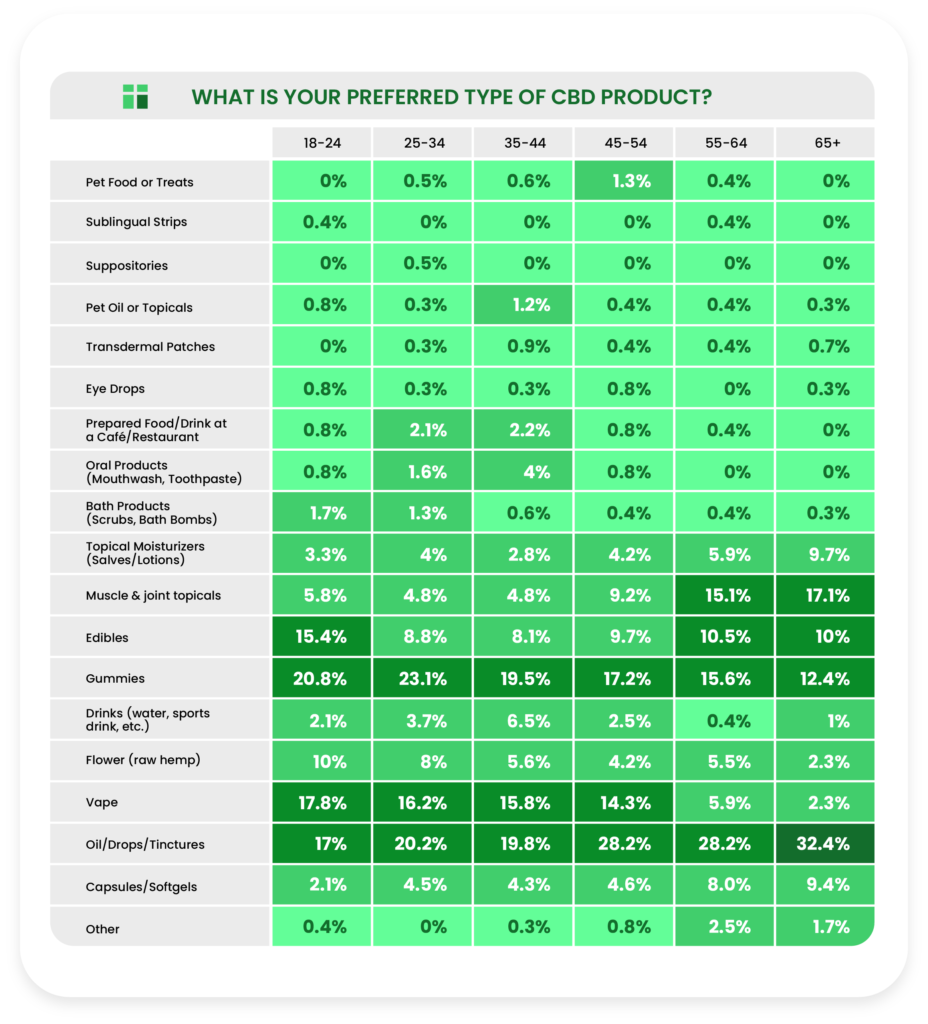
For “oil/drops/tinctures,” the three youngest groups (approximately 19%) were less responsive than the oldest three groups (approximately 29%). For “vape” and “gummies,” we observed gentle downward trends with increasing age.
Gender
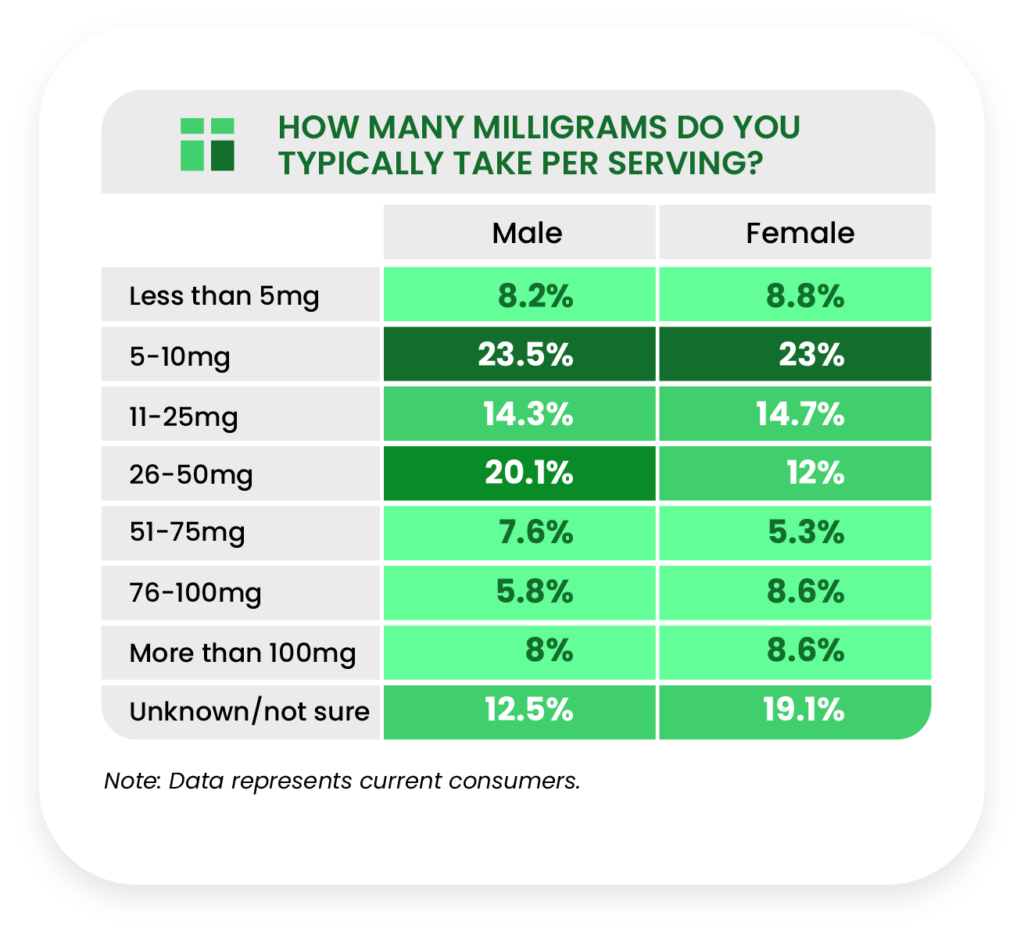
A greater portion of male current consumers take between 25-50mg/serving of CBD (20.1% of men vs 12% of women), but women catch up at the 100mg+ response (8.6% women to 8% men).
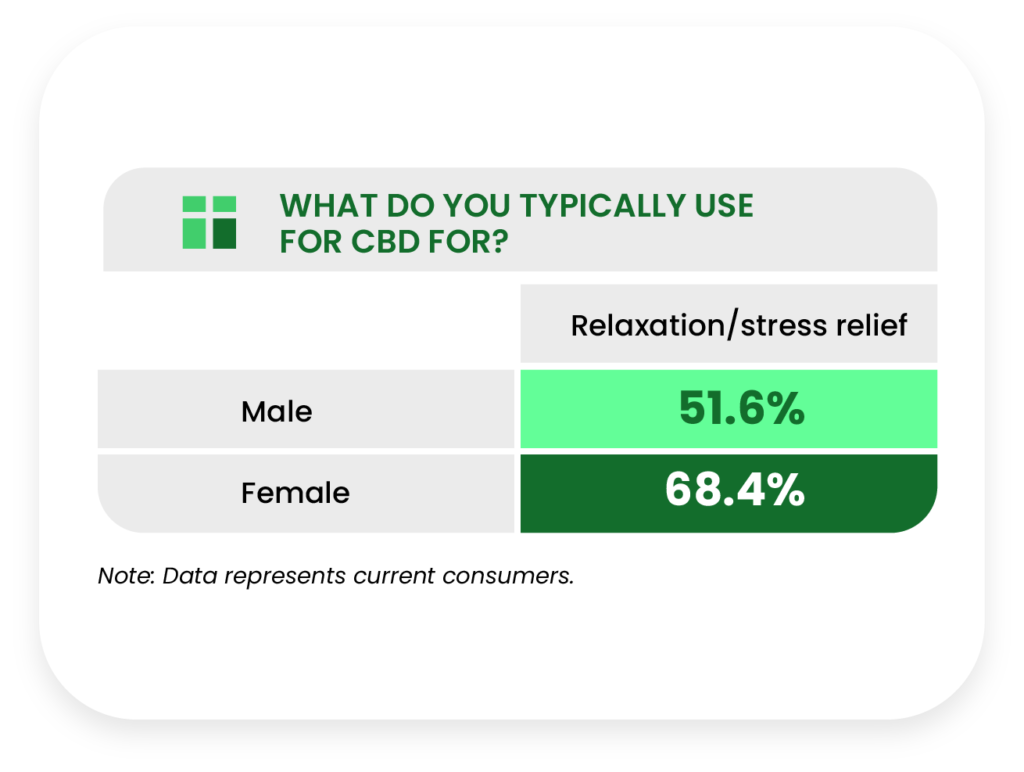
Female current consumers are significantly more likely to use CBD for relaxation and stress relief (68.4%) than men (51.6%), a trend we also noted in last year’s report.
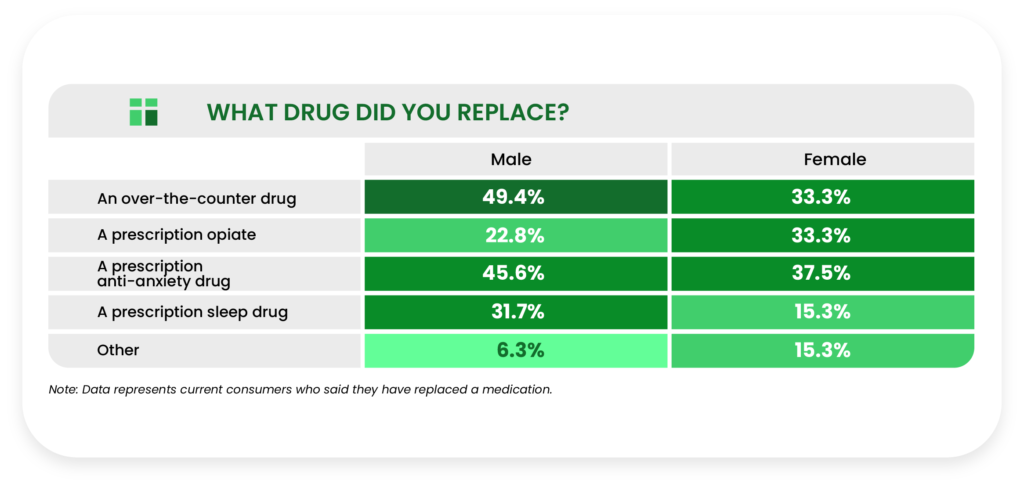
Among respondents who used CBD to replace a drug, men were more likely to replace over-the-counter drugs (49.4% vs 33.3% of women), and women were more likely to replace prescription opiates (33.3% vs 22.8% of men).
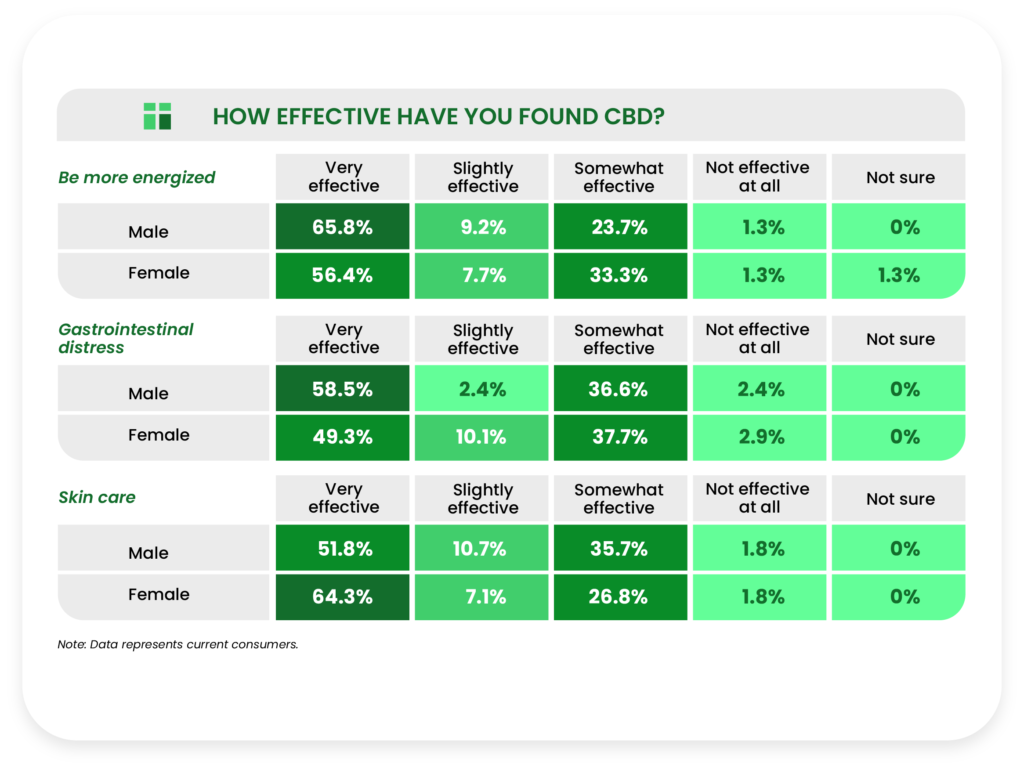
We found statistically significant disparities in how effective each gender found CBD to be for gastrointestinal distress, skin care, and improvements in energy.
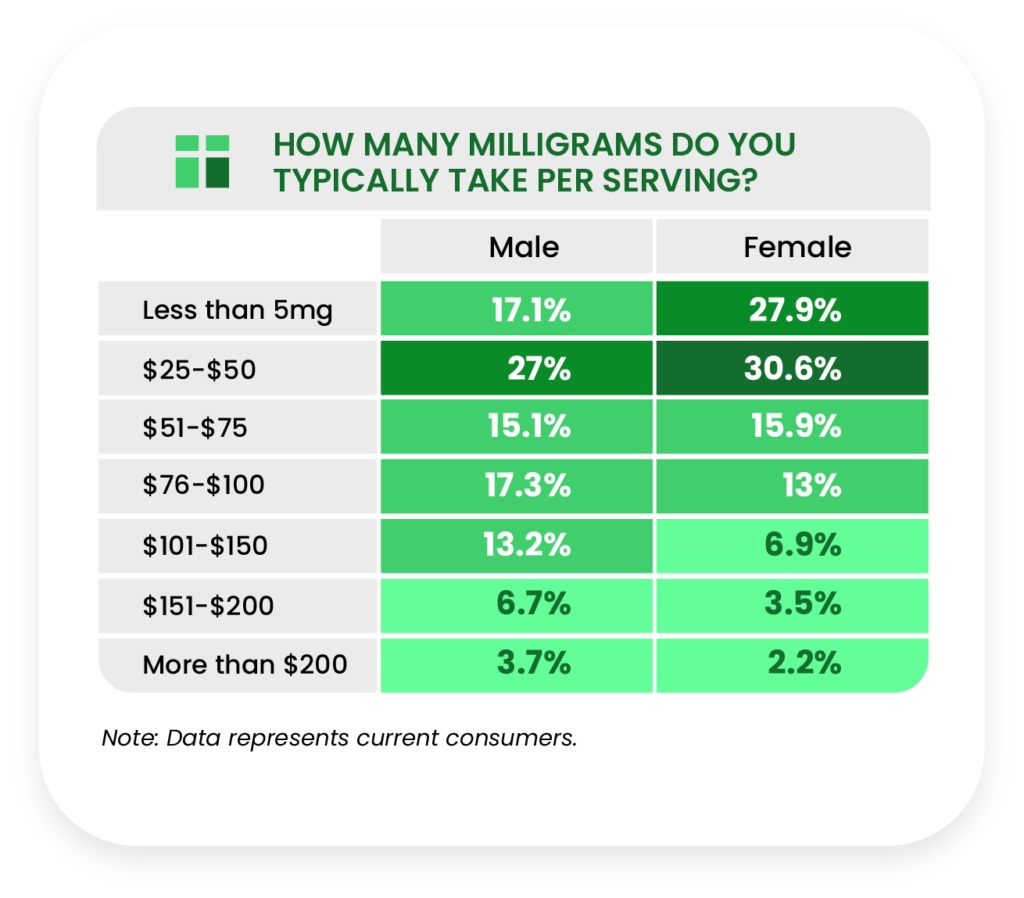
Women who are current consumers were consistently more likely to spend less money per month on CBD, outscoring men in the “less than $25,” “$25-$50,” and $51-$75” categories, while men outscored women in every other category.
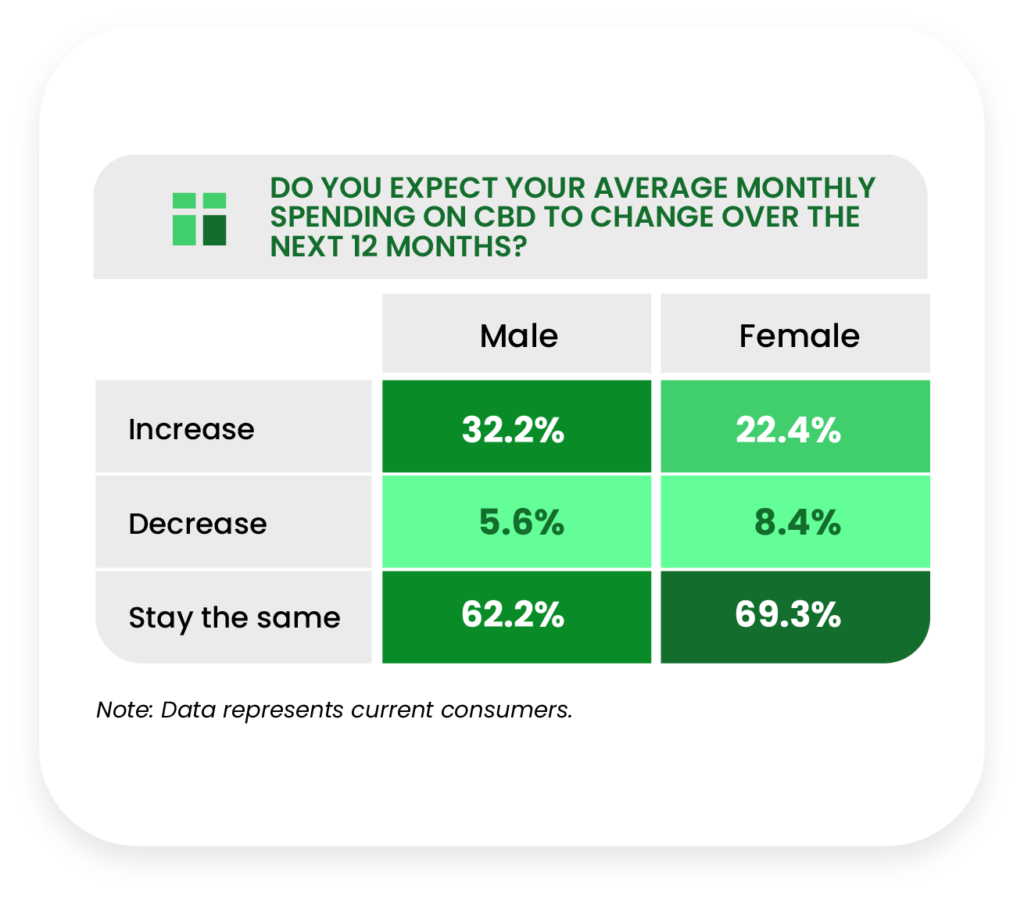
Perceptions about future CBD spending were also somewhat conflicting across genders, with 32.2% of men expecting their spending to increase over the next year vs 22.4% of women.
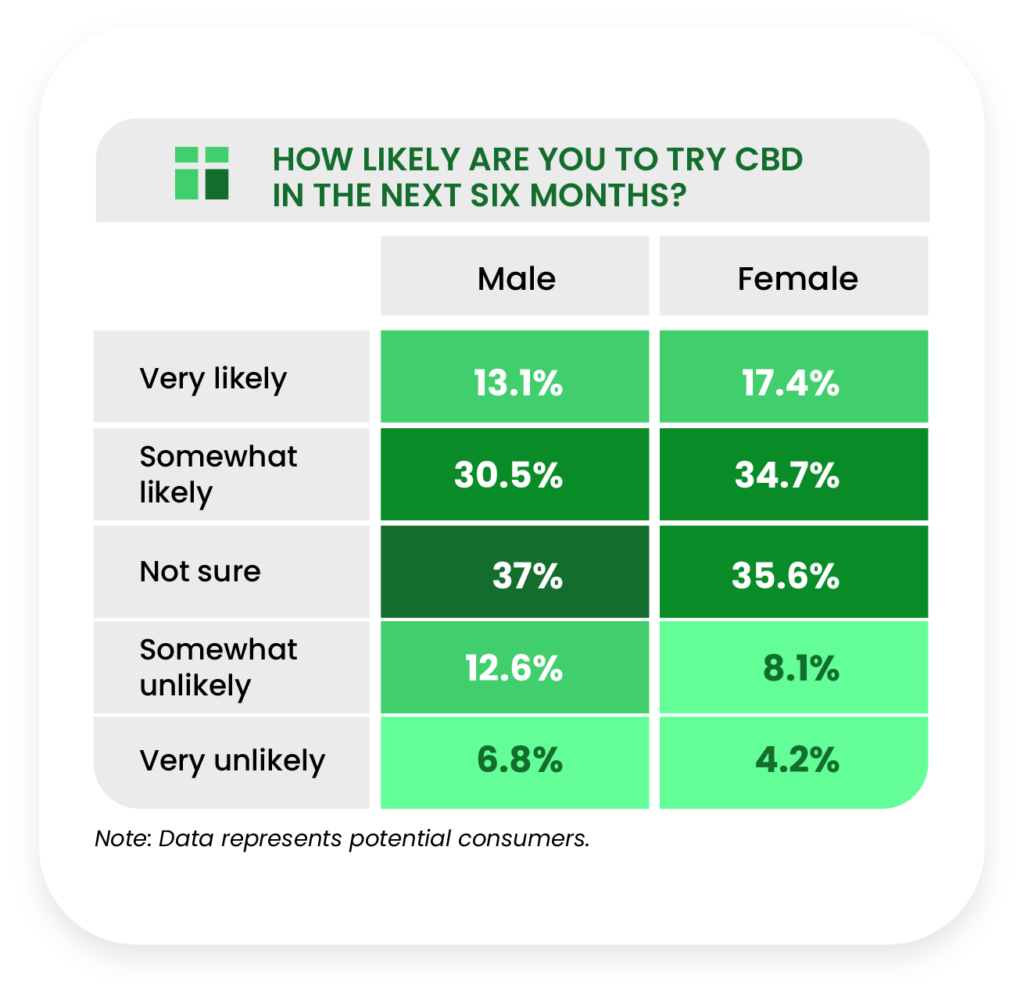
Female potential consumers were more open to trying CBD in the near future. More than half (52.1%) of women said they are “very likely” or “somewhat likely” to try CBD in the next six months, compared to 44.6% of men.
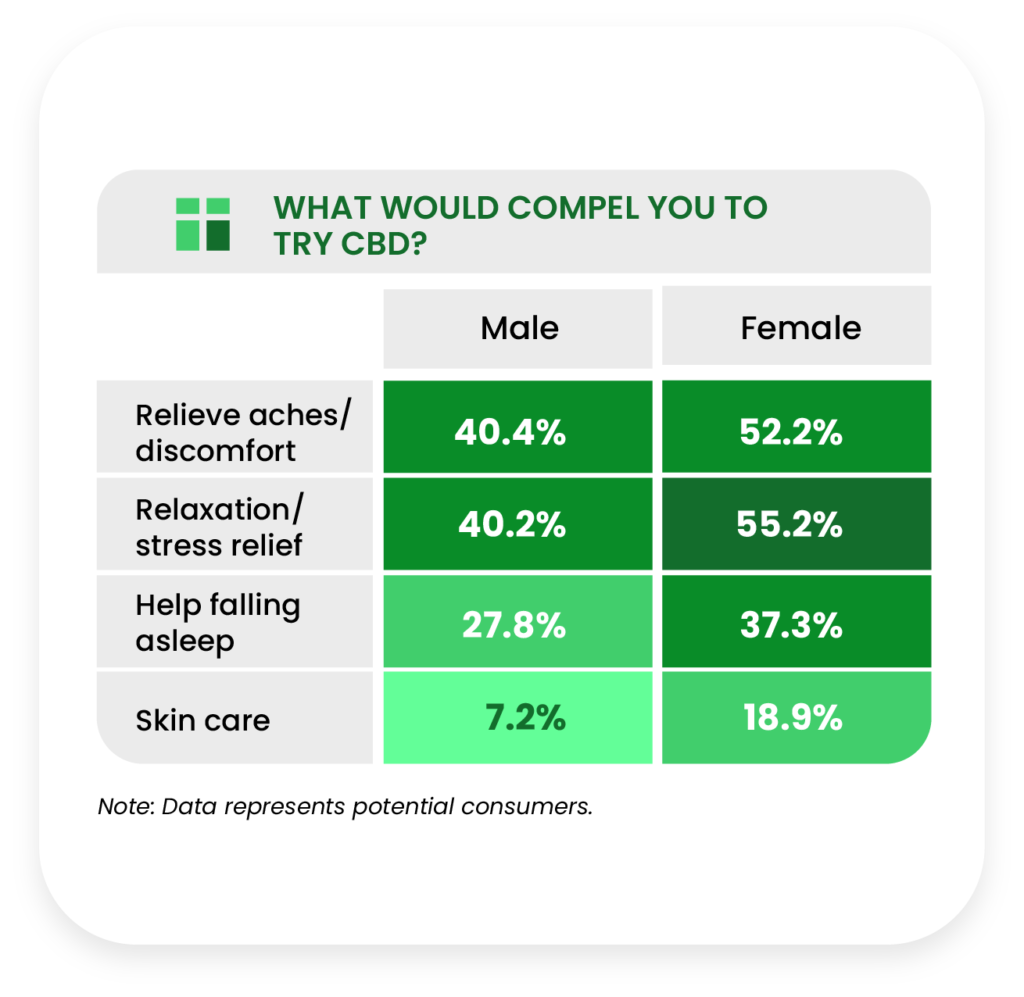
When asked what might compel them to try CBD, the greatest disparities across genders were for relieving aches and discomfort, relaxation and stress relief, help falling asleep, and skin care.
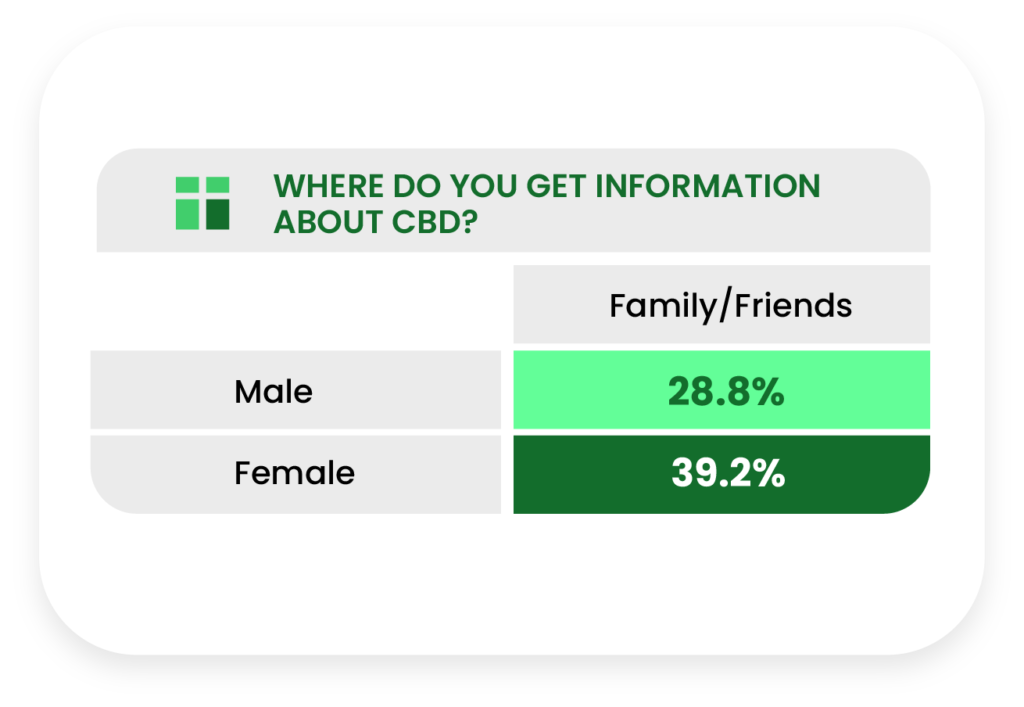
As for where each gender gets their CBD information from, women were significantly more likely to rely on friends and family (39.2%) than men (28.8%), a trend that persisted from our last consumer report.
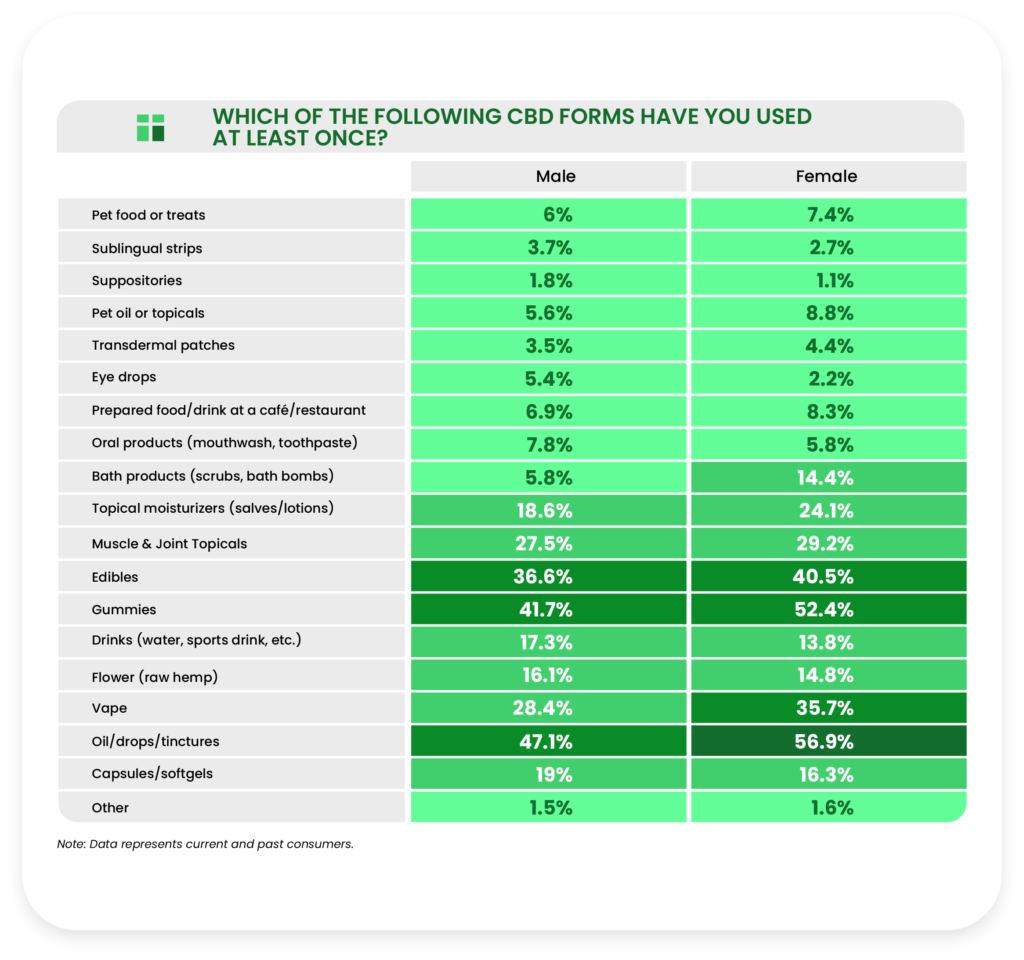
Women were more likely than men to have used CBD gummies (52.4% vs 41.7% of men) as well as oils/drops/tinctures (56.9% vs 47.1% men).
Race
Note: Because of drastically smaller sample sizes that created artificially inflated disparities in the data, many data tables will not show responses from Asian or Asian American, Native American or Alaskan Native, and Native Hawaiian or other Pacific Islander groups.
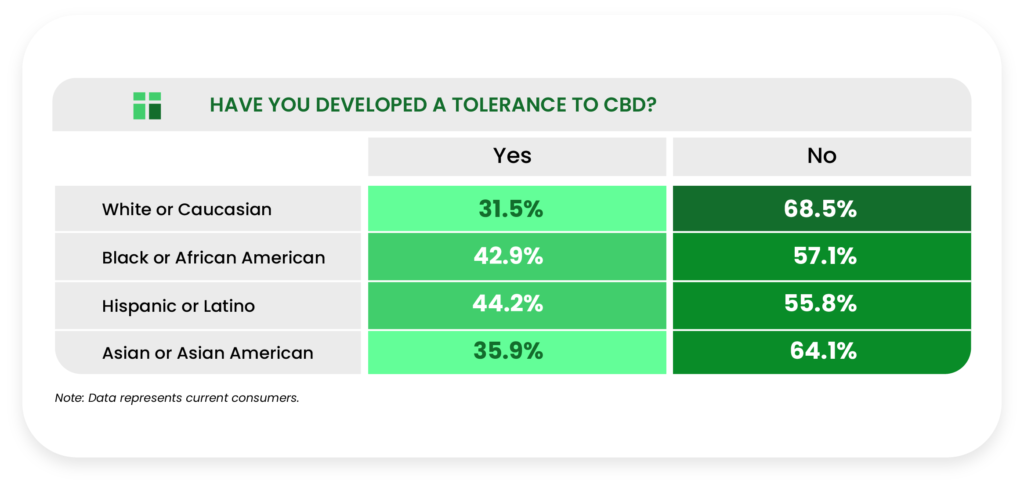
When asked if current consumers had developed a tolerance to CBD, the White or Caucasian group was significantly underrepresented (31.5%) compared to Black or African American (42.9%) and Hispanic or Latino (44.2%) groups.
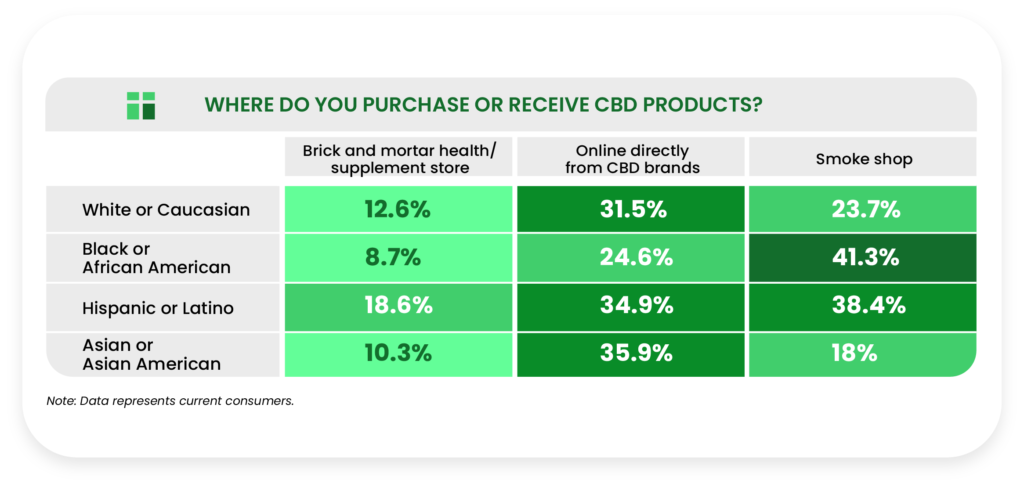
Blacks or African Americans are less likely to acquire CBD from brick-and-mortar stores and online directly from a CBD brand than other races; however, they are more likely to acquire CBD from smoke shops.
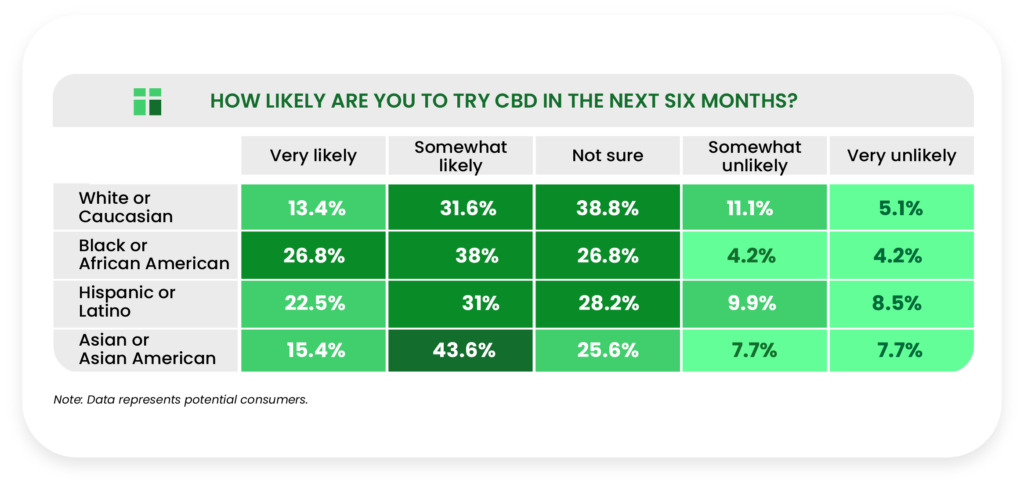
The Black or African American, Hispanic or Latino, and Asian or Asian American groups of potential consumers are more likely to try CBD in the next six months than White or Caucasian respondents.
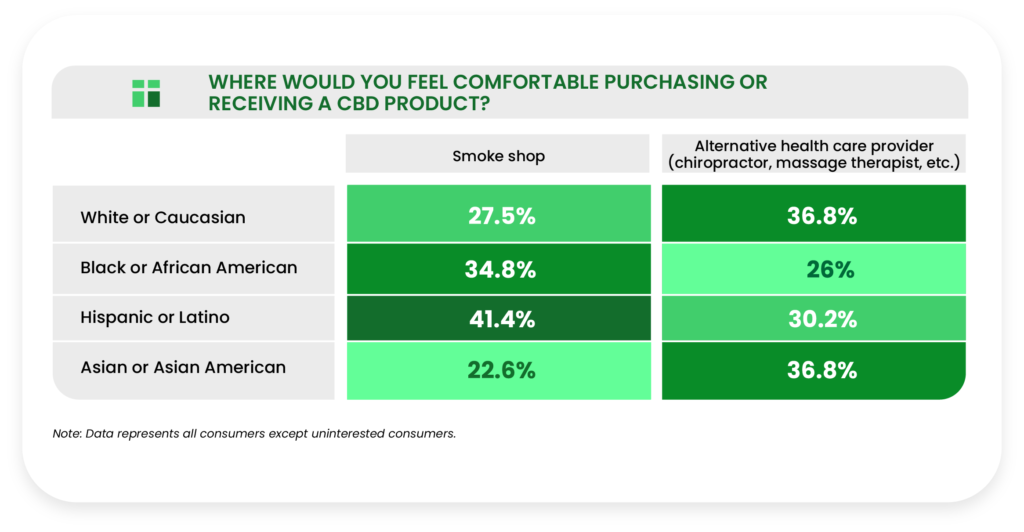
Whites or Caucasians are significantly more likely to utilize their healthcare providers. Conversely, Hispanic or Latino respondents are significantly more comfortable purchasing CBD from a smoke shop (41.4%) than Whites or Caucasians (27.5%).
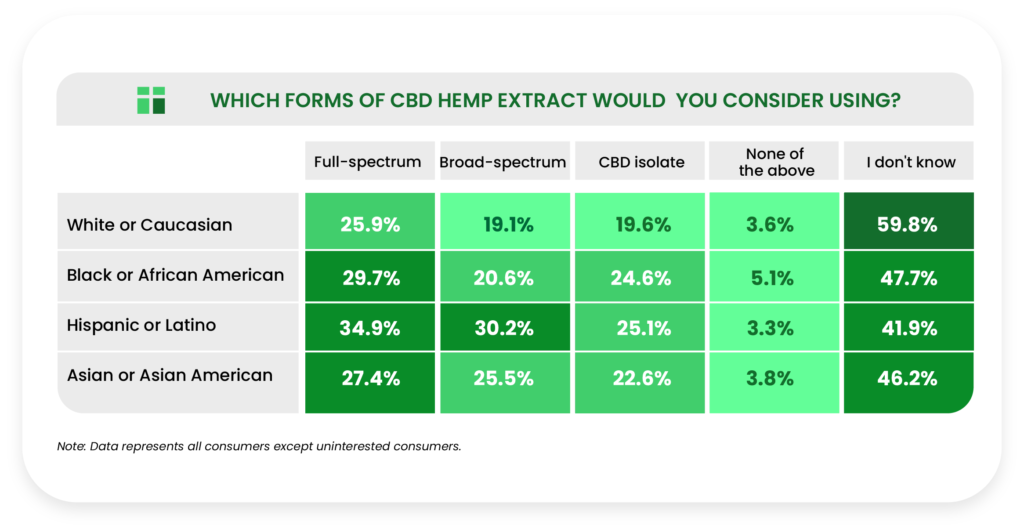
More White or Caucasian respondents (59.8%) indicated they didn’t know which form of CBD hemp extract they would consider using compared to Blacks or African Americans (47.8%) and Hispanic or Latino respondents (41.9%).
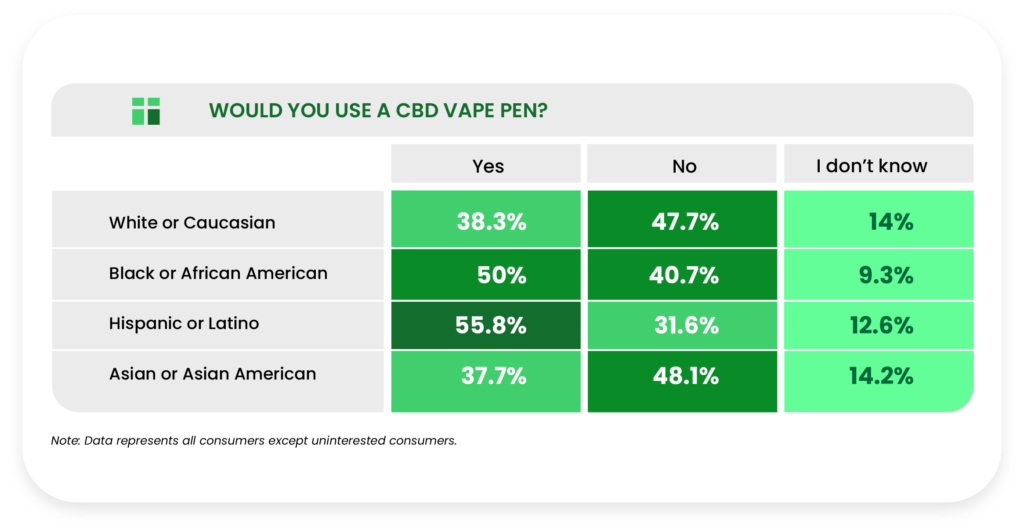
We saw striking disparities across racial groups in the openness to using CBD vape pens, with White or Caucasian (38.3%) and Asian or Asian American (37.7%) groups trailing Black or African American (50%) and Hispanic or Latino (55.8%) groups by double-digit margins.
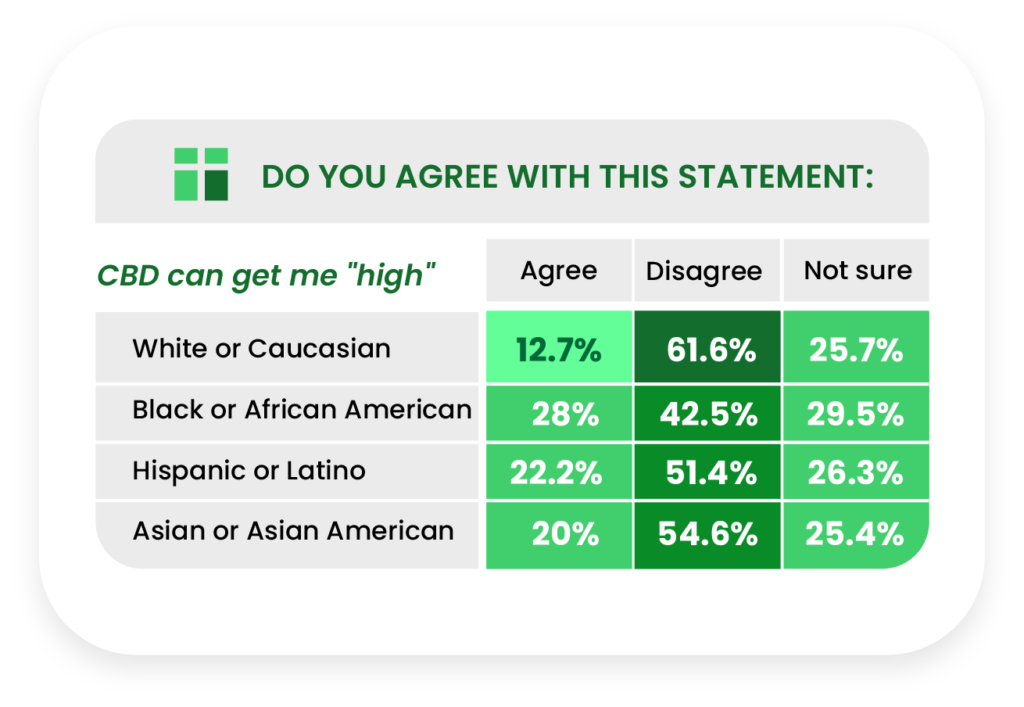
Whites or Caucasians were significantly less likely to agree with the statement that CBD can elicit a high (12.7%) than Blacks or African Americans (28%), Hispanic or Latino respondents (22.2%), and Asians or Asian Americans (20%).
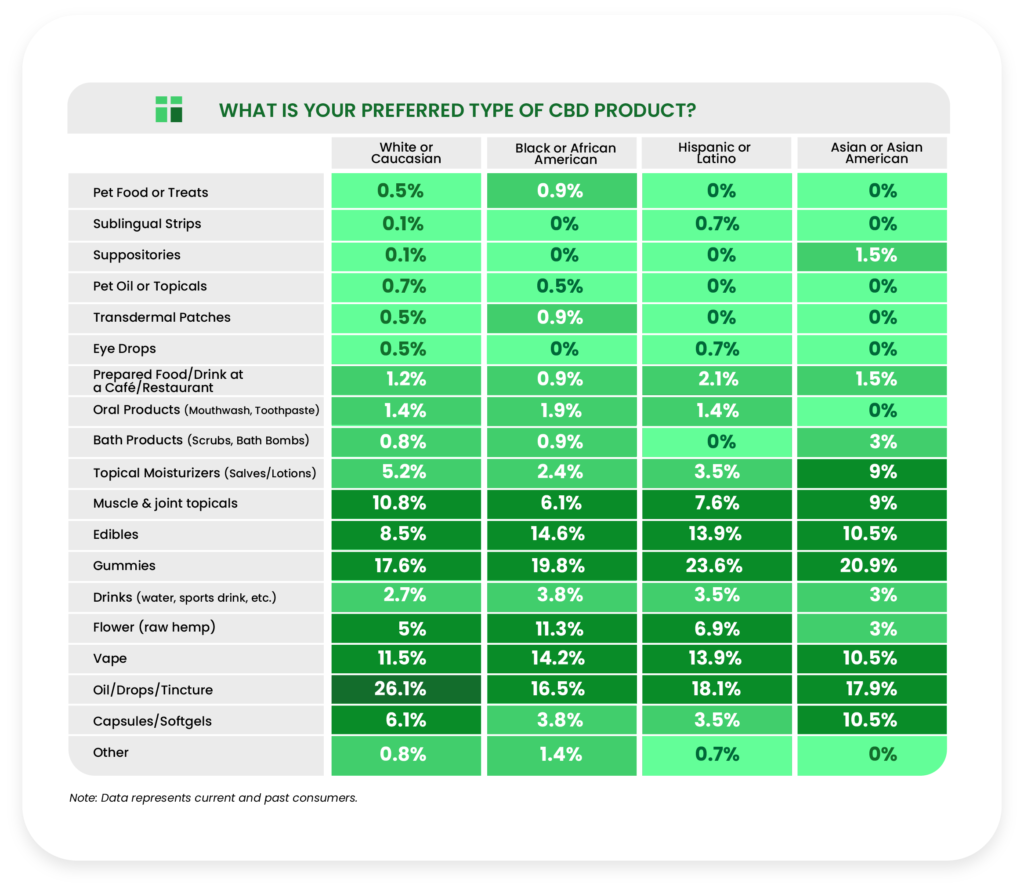
When asked about their preferred type of CBD products, Whites or Caucasians were significantly more likely to select oils/drops/tinctures (26.1%) than all other races.
Region
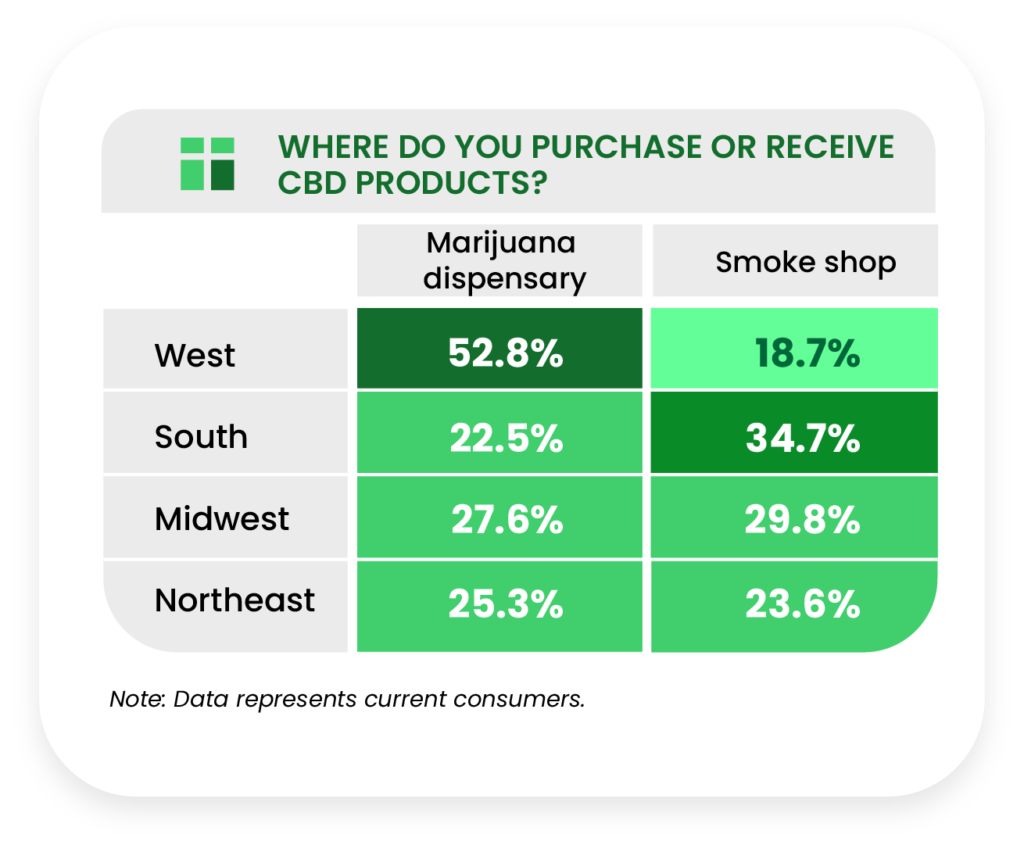
As expected, the Western United States dominated when it came to engagement with and interest in marijuana dispensaries. This trend follows data from our previous report. However, those in the West are less likely to acquire CBD from smoke shops.
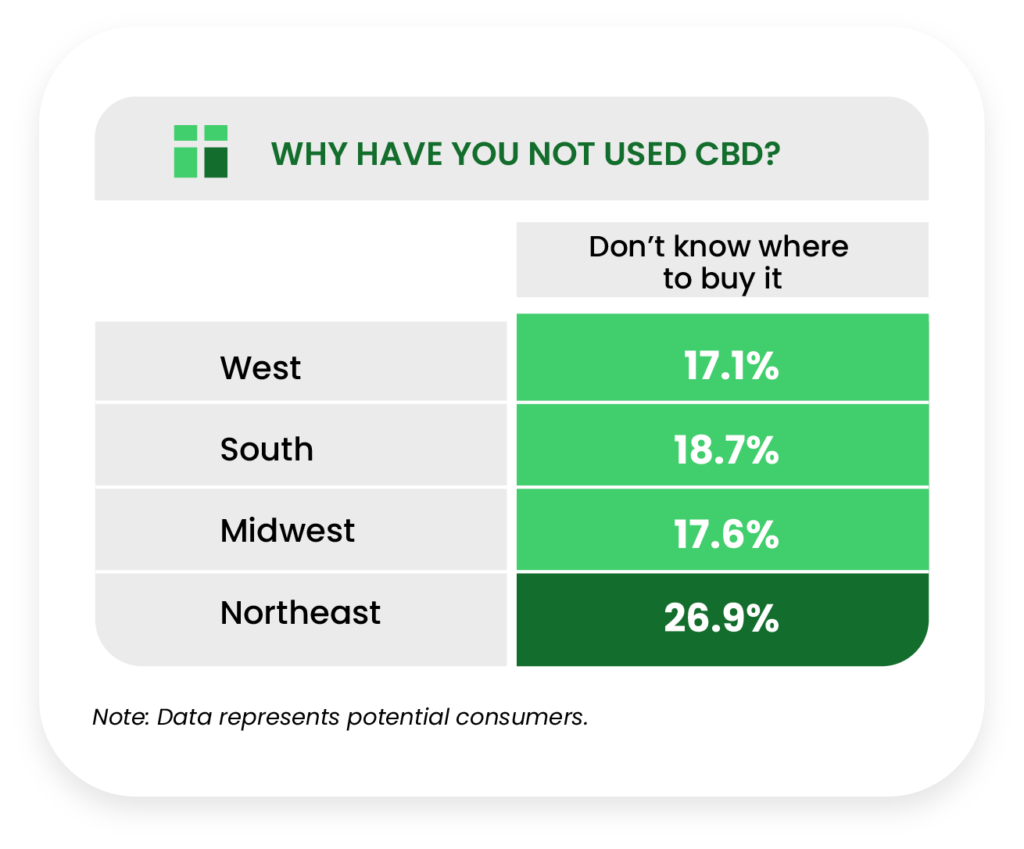
Potential consumers who stated they hadn’t tried CBD because they didn’t know where to buy it were more highly represented in the Northeast region (26.9%) than all others (South in second place with 18.7%).
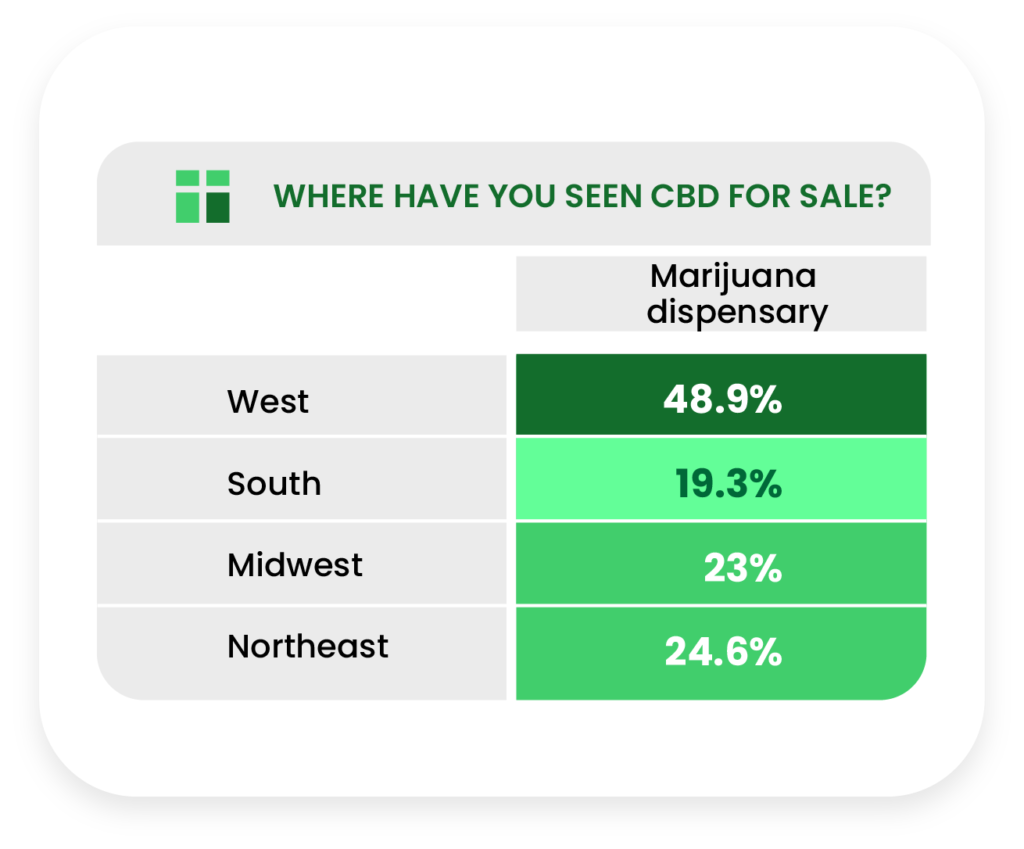
When asked where they had seen CBD for sale, respondents from the Western US were much more likely to select “marijuana dispensary,” (48.9%) than any other region (Northeast region was second at 24.6%).
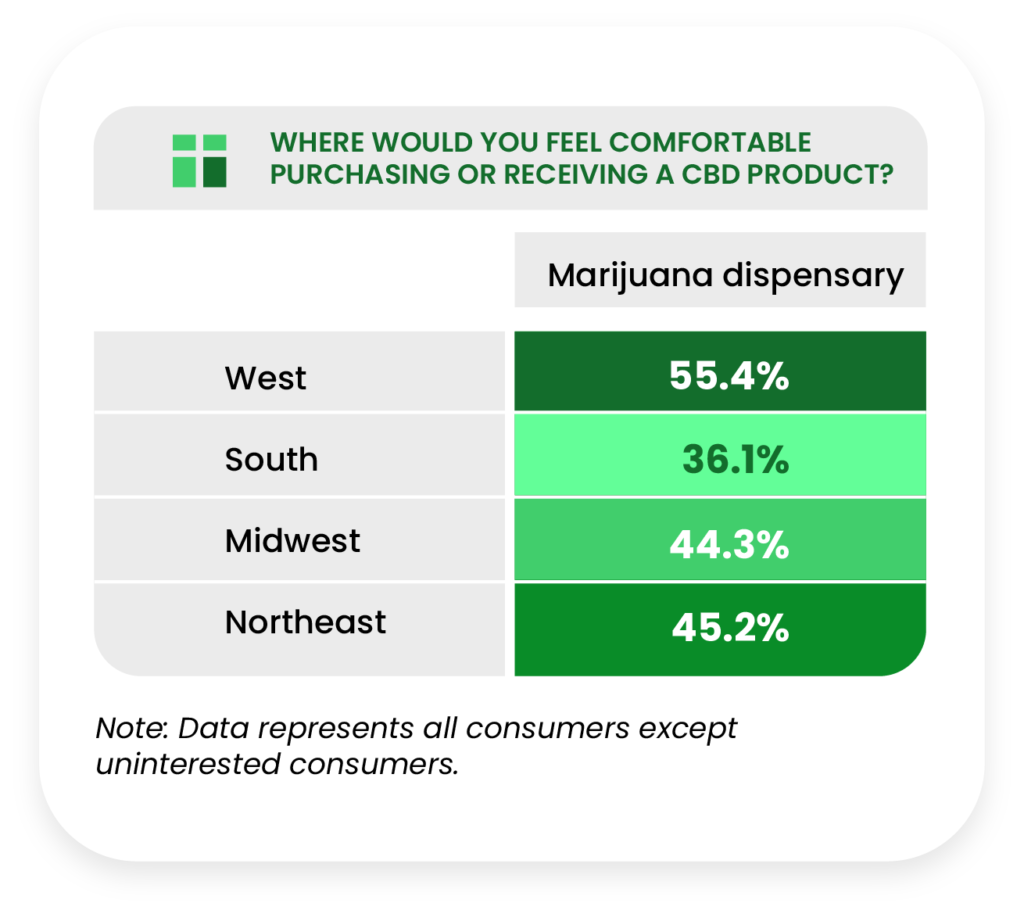
Dispensaries are also where respondents from the West feel most comfortable purchasing CBD products.
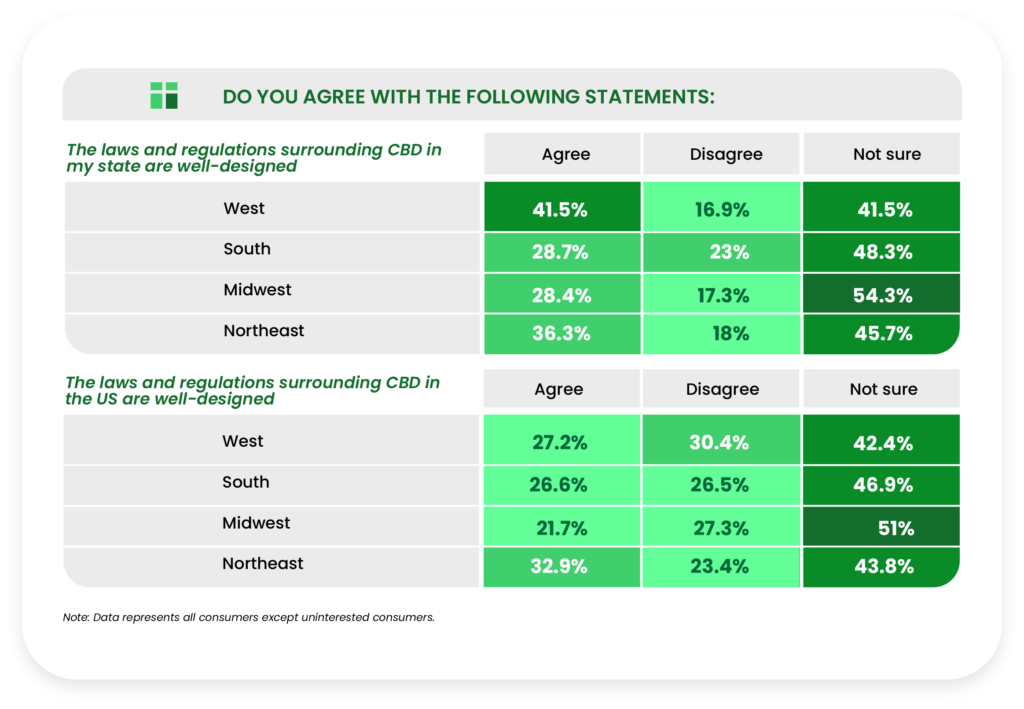
The West is more likely to agree that CBD laws are well-designed in their states, while the South and Northeast are more likely to think national laws are well-designed.
Education
Note: Some education levels may not be displayed in the following data tables because of low sample sizes.
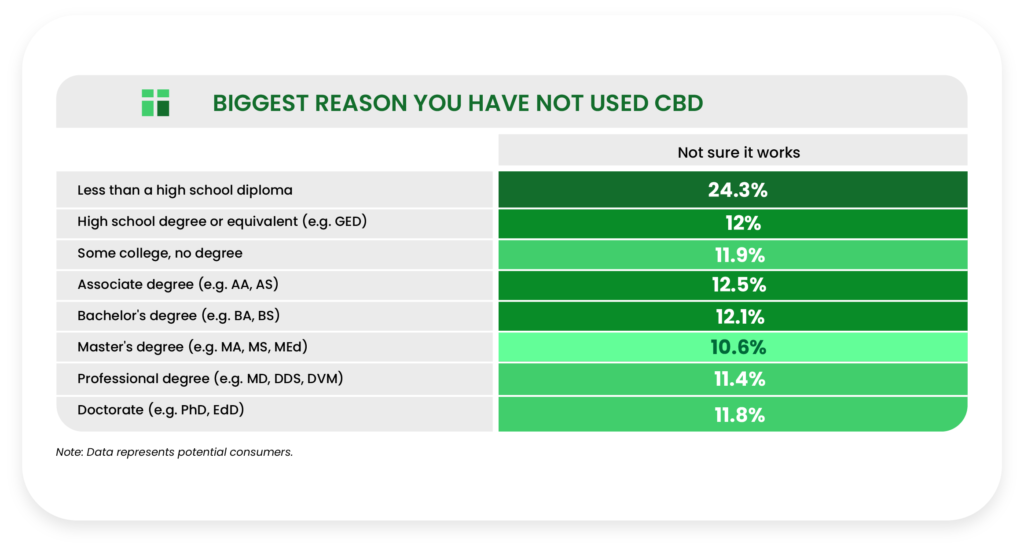
Respondents with less than a high school diploma were more likely to cite not knowing how CBD works (24.3%) as the biggest reason they have yet to try CBD.
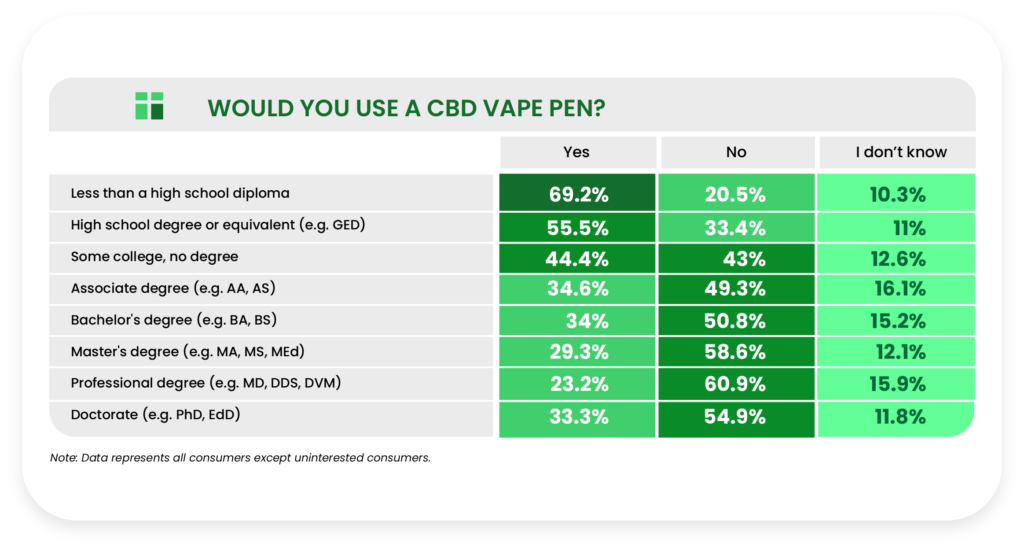
Respondents with a high school diploma (55.5%) or less (69.2%) were significantly more open to the idea of using a CBD vape pen than all other respondents (next closest was the some college group at 44.4%).
Income
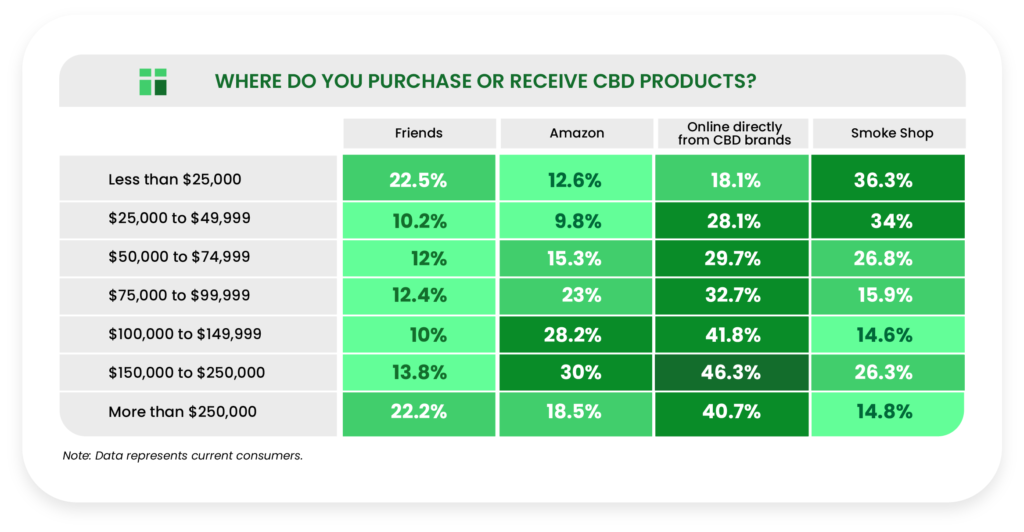
With the exception of the highest income group, more respondents ordered directly from CBD brands online as income levels increased. Conversely, incidence decreases with increasing income for the “smoke shop” response.
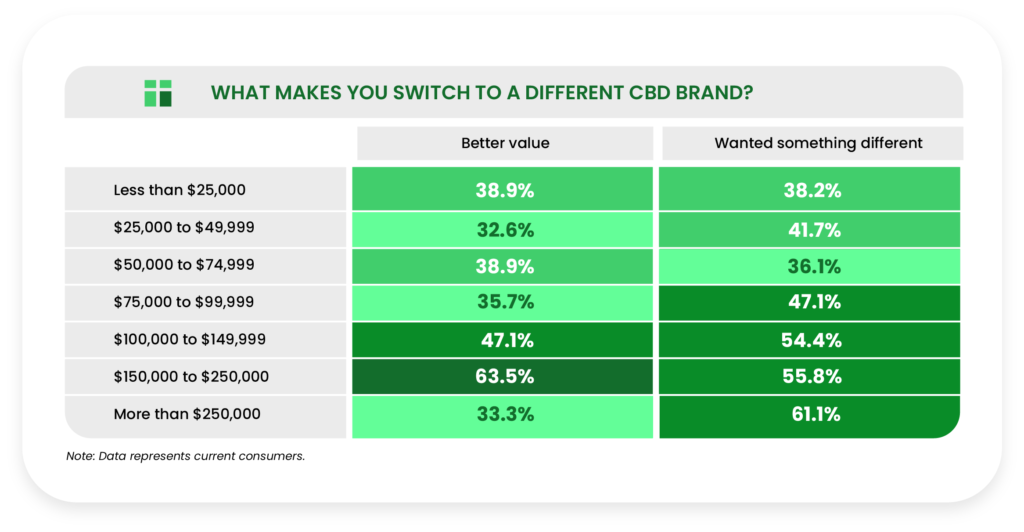
Despite what may be assumed, higher income groups were more likely to switch CBD brands because they found a better value. We also observed a positive correlation with income for respondents who simply “wanted something different.”
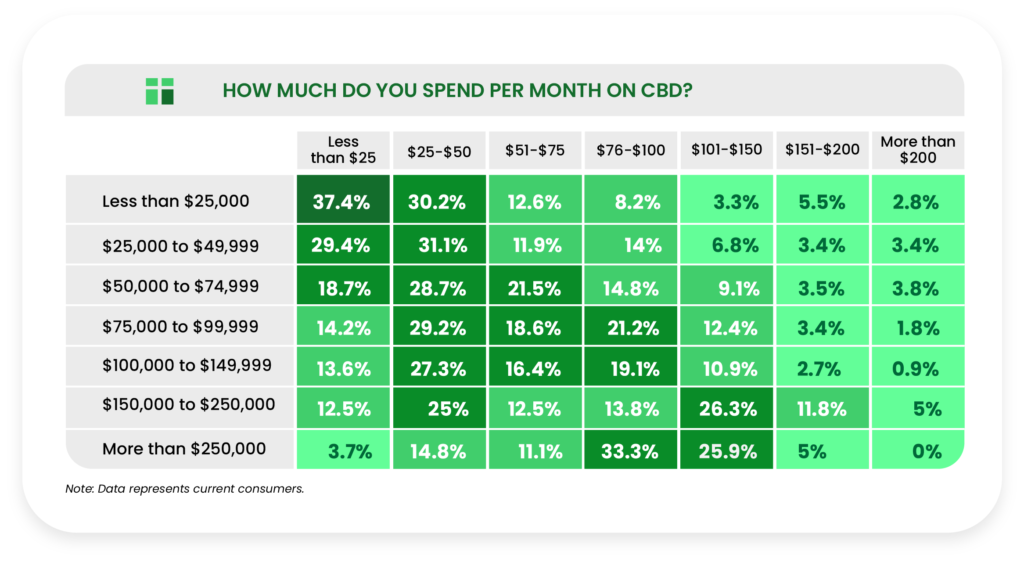
Regarding monthly CBD spending, the less than $25,000 income group was roughly three times as likely to spend less than $25 a month on CBD (37.4%) than the $150,000-$250,000 group (12.5%) and ten times more likely to do so than the $250,000+ group (3.7%).
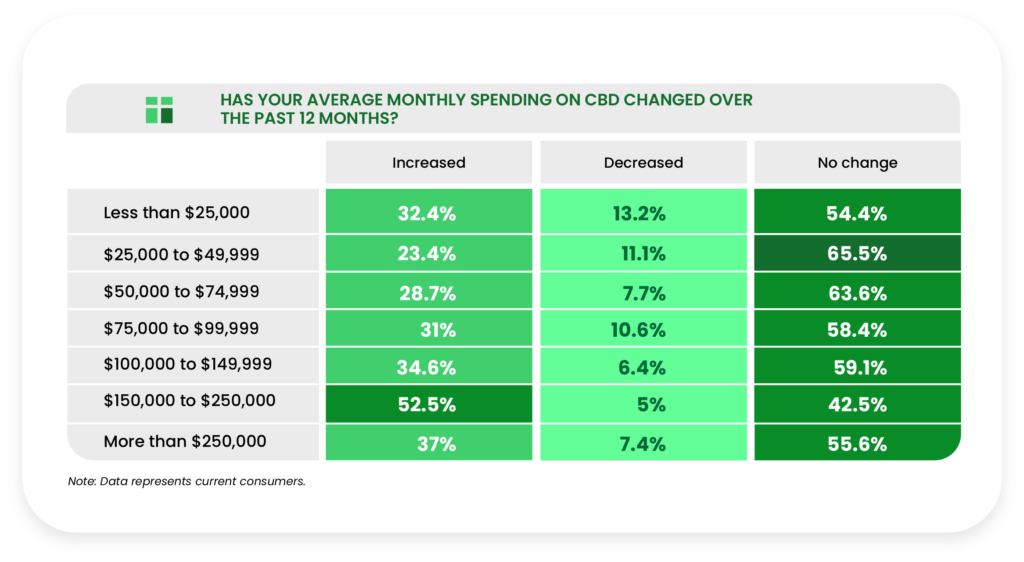
The two highest income groups were the most likely to report that their average monthly CBD spending had increased over the past 12 months.
The two highest income groups were much more likely to expect their average monthly CBD spending to decrease over the next 12 months.
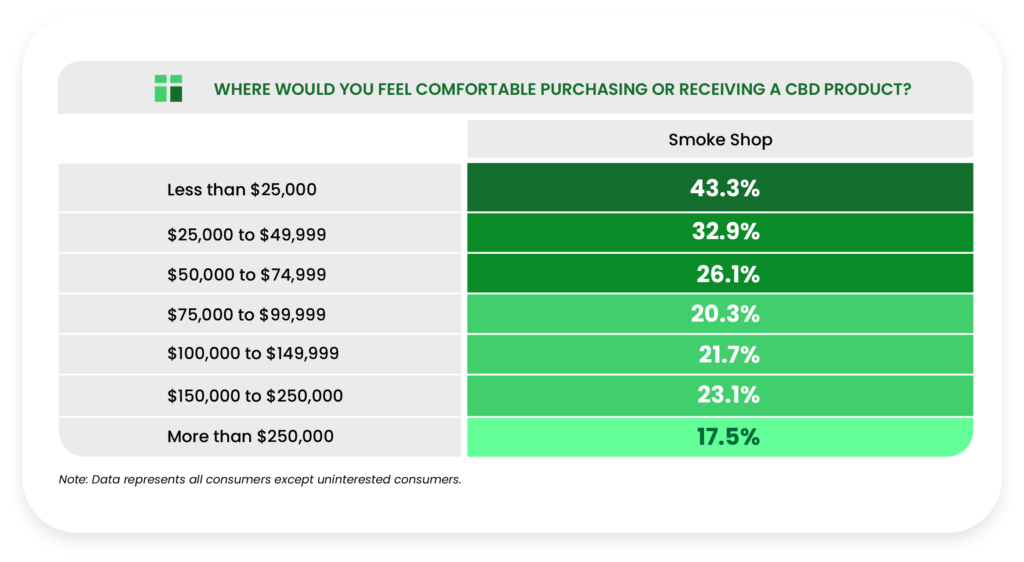
We observed a negative trend when respondents were asked how comfortable they were acquiring CBD from a smoke shop, decreasing from 43.3% in the lowest income group to 17.5% in the highest income group.
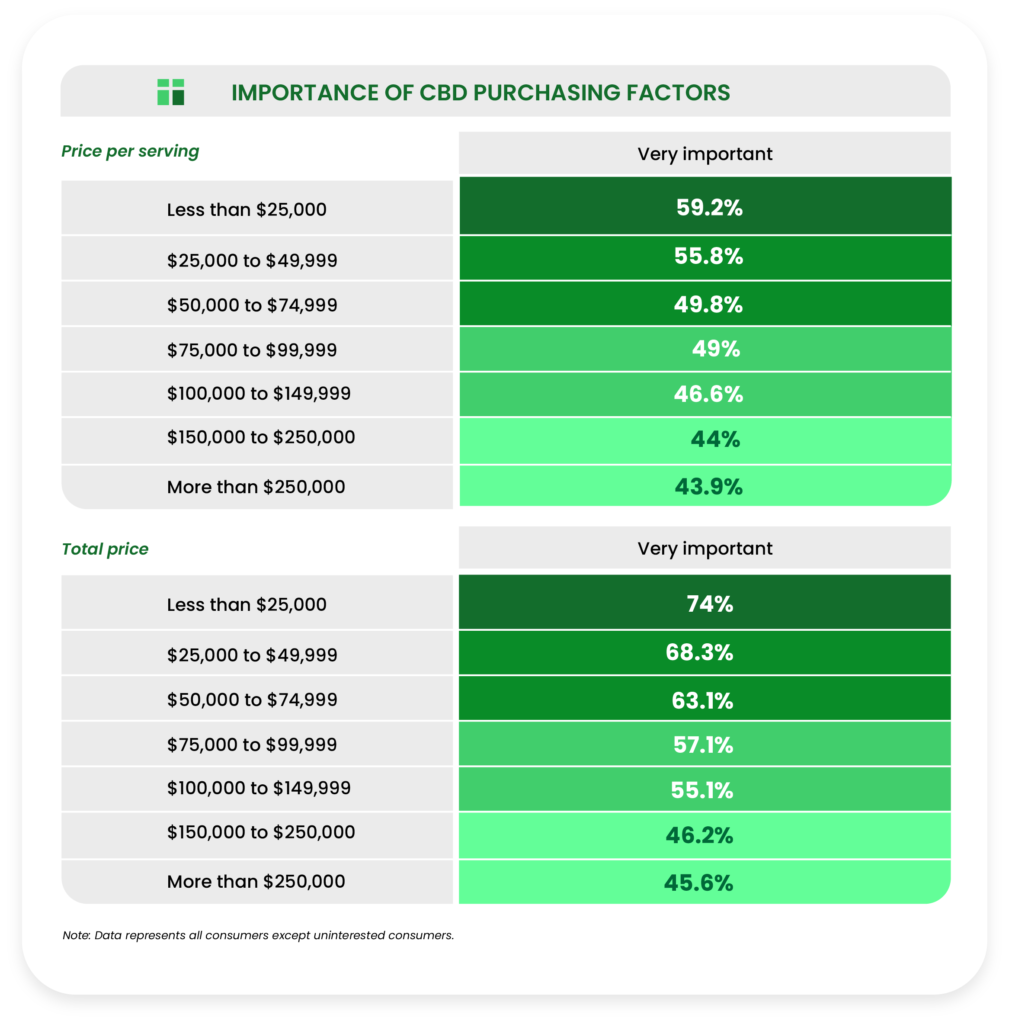
Though they seemed more concerned with value when it came to incentives for switching brands, higher income groups responded more predictably when gauging the importance of price per serving and total price to purchasing decisions.
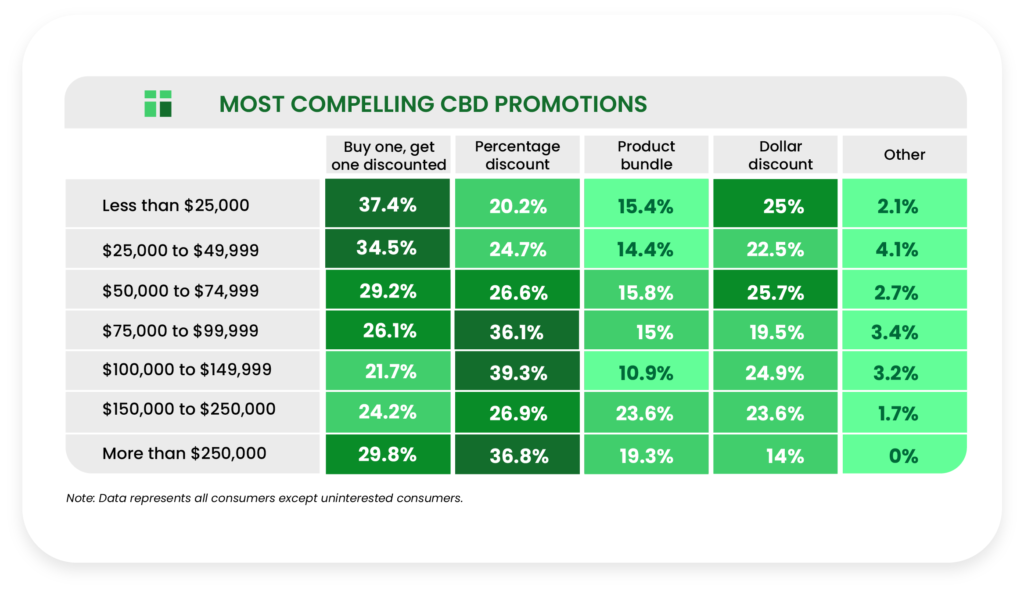
Higher income groups were comparatively less fond of “BOGO” (buy one, get one discounted/free) pricing promotions than lower income groups. Conversely, we saw a positive trend with increasing income for preference of percentage discounts.
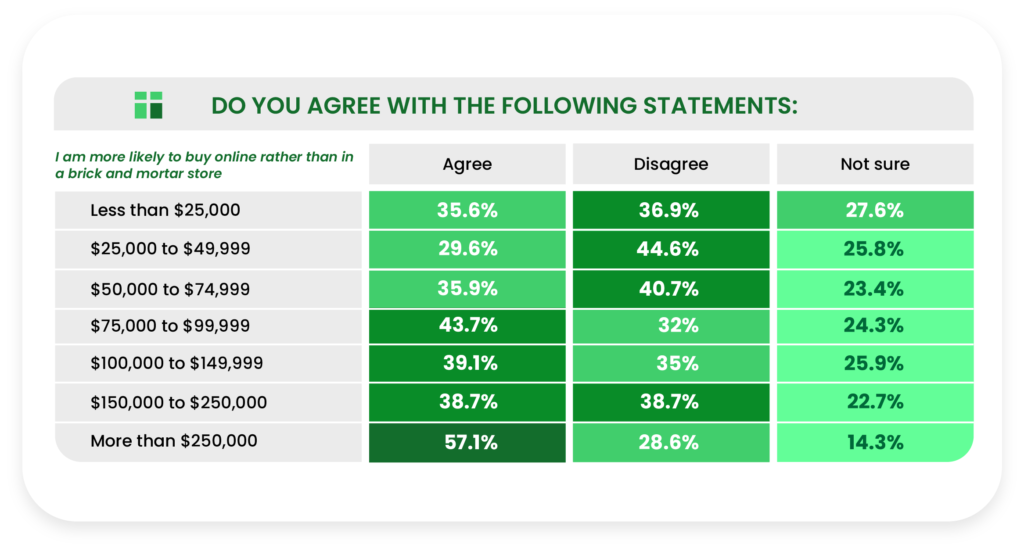
Concerning preferred buying options, the highest income group is significantly more likely to buy CBD online than in a brick and mortar store.
Military
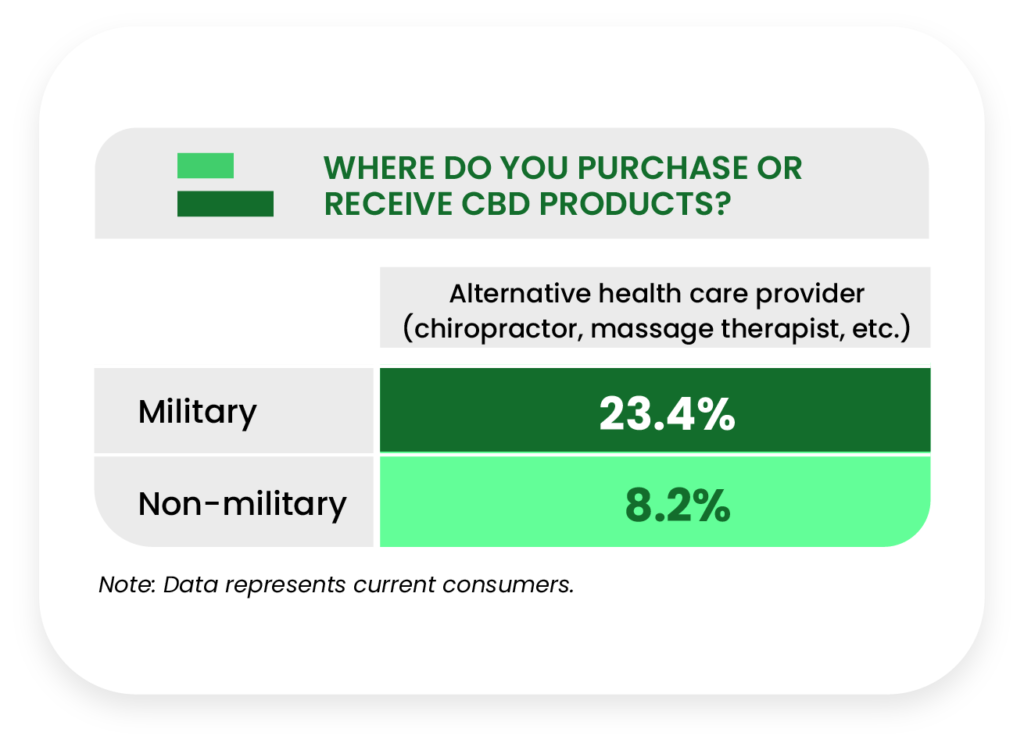
Military-affiliated respondents (active duty, reservists, and veterans combined) were significantly more likely to purchase/receive CBD products from alternative health care providers (23.4%) than non-military respondents (8.2%).
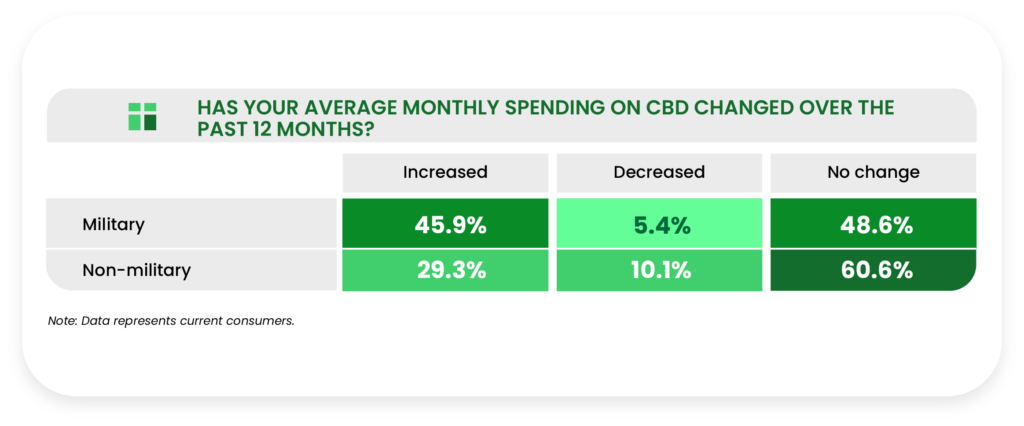
Military respondents were more likely to report that their average monthly spending on CBD had increased over the past year, outpacing non-military respondents 45.9% to 29.3%.
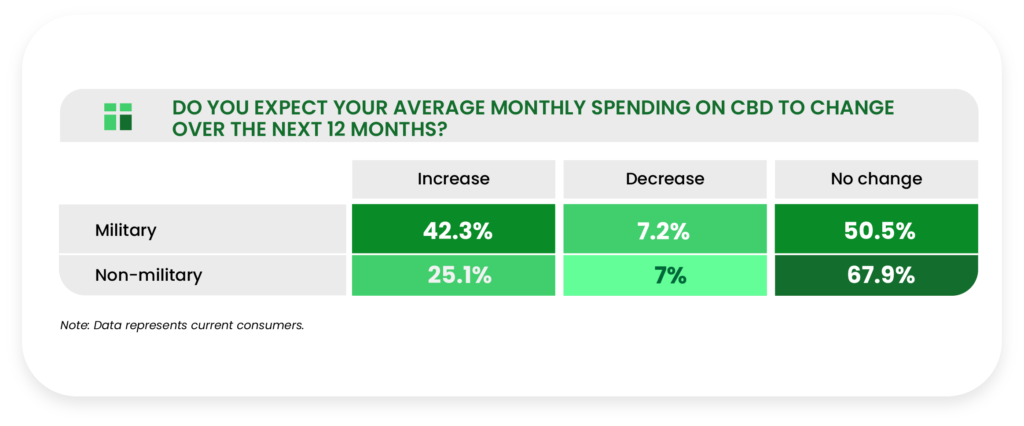
On the issue of future CBD spending expectations, 42.3% of military respondents expected their spending to increase versus 25.1% of non-military respondents.
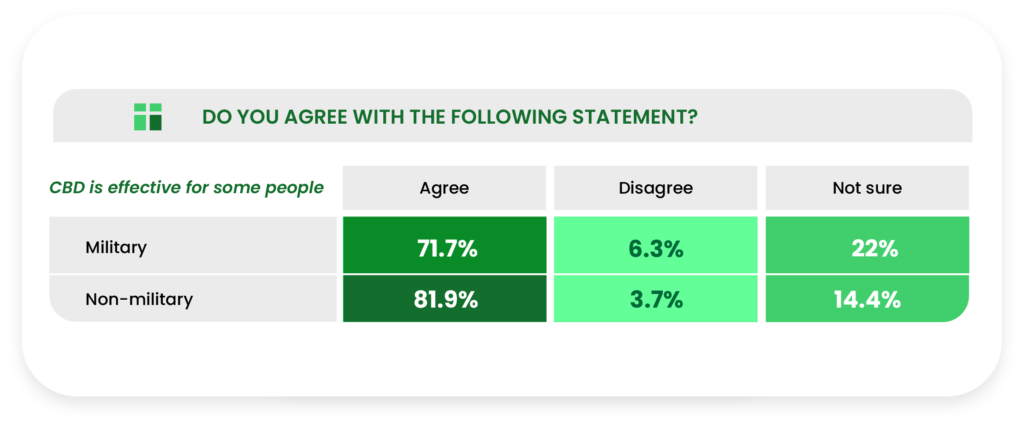
Concerning the perception of CBD’s effectiveness, military respondents were less agreeable with the claim that CBD is effective for some people.
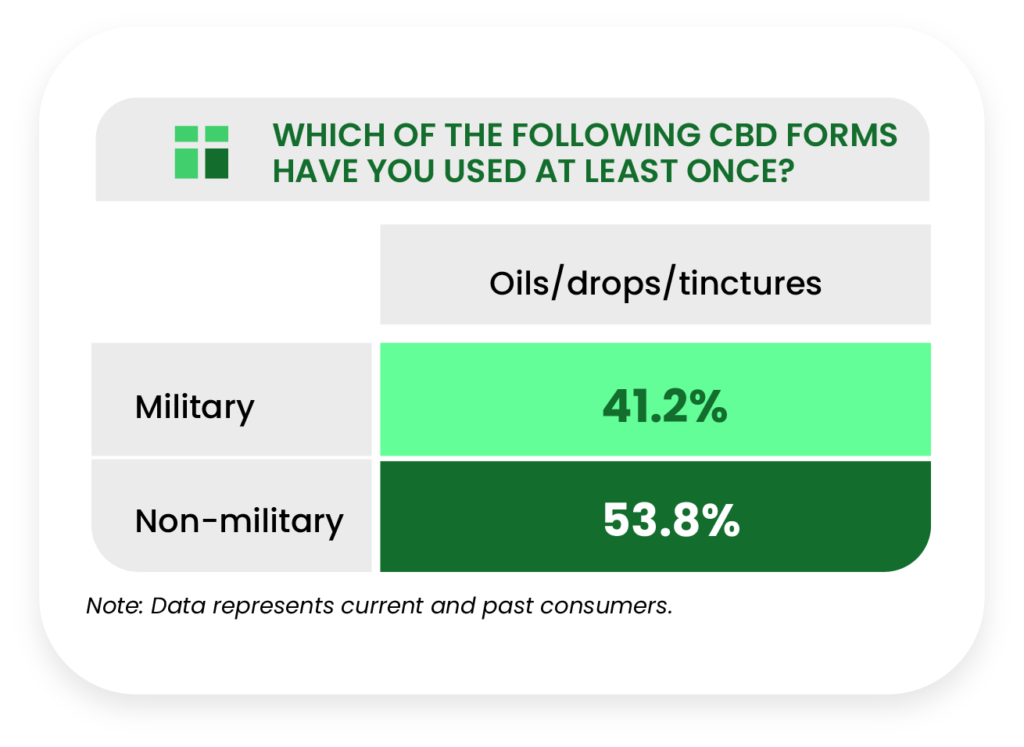
Finally, non-military respondents were more likely to have used oils/drops/tinctures at least once (53.8%) than military respondents (41.2%), a finding concurrent with data from our previous report.
Disability
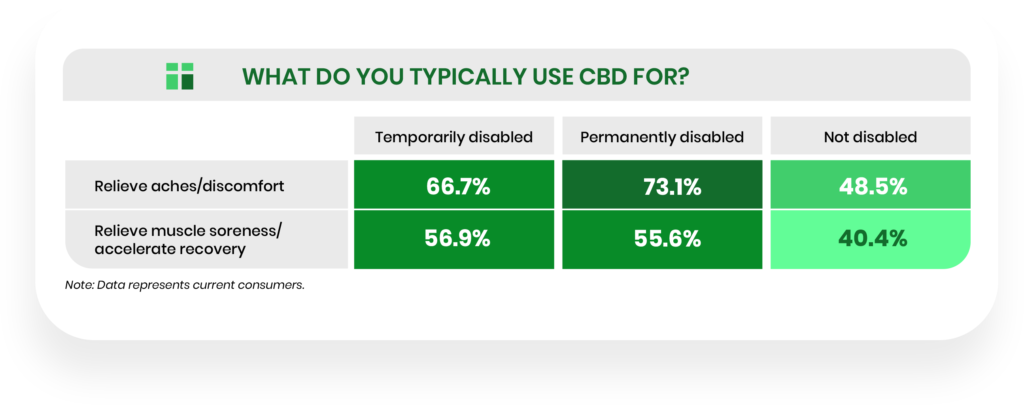
When asked what they typically use CBD for, permanently disabled respondents were significantly more likely to cite relieving aches and discomfort and relieving muscle soreness and recovery than non-disabled respondents.
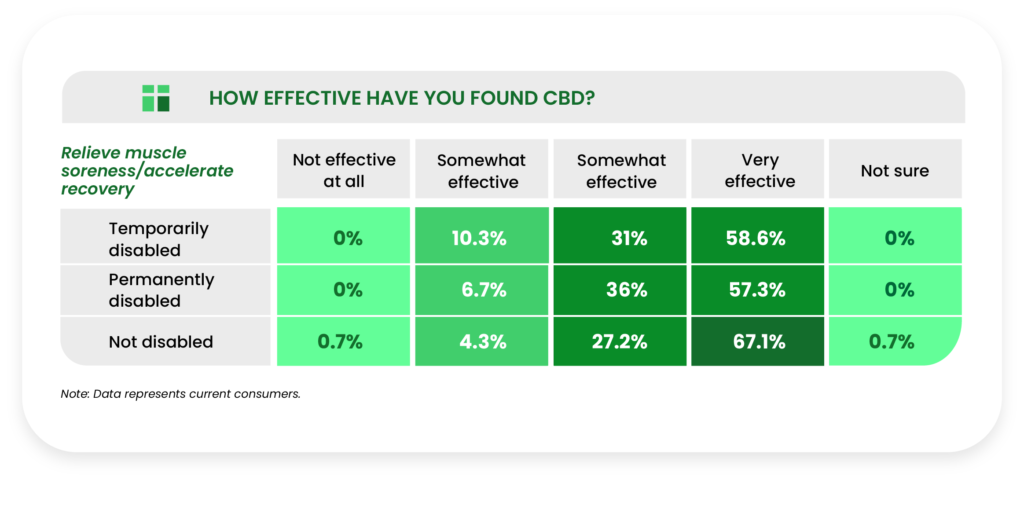
In terms of CBD uses that respondents found “very effective,” we found a strong disparity between disabled and non-disabled respondents for muscle soreness and recovery.
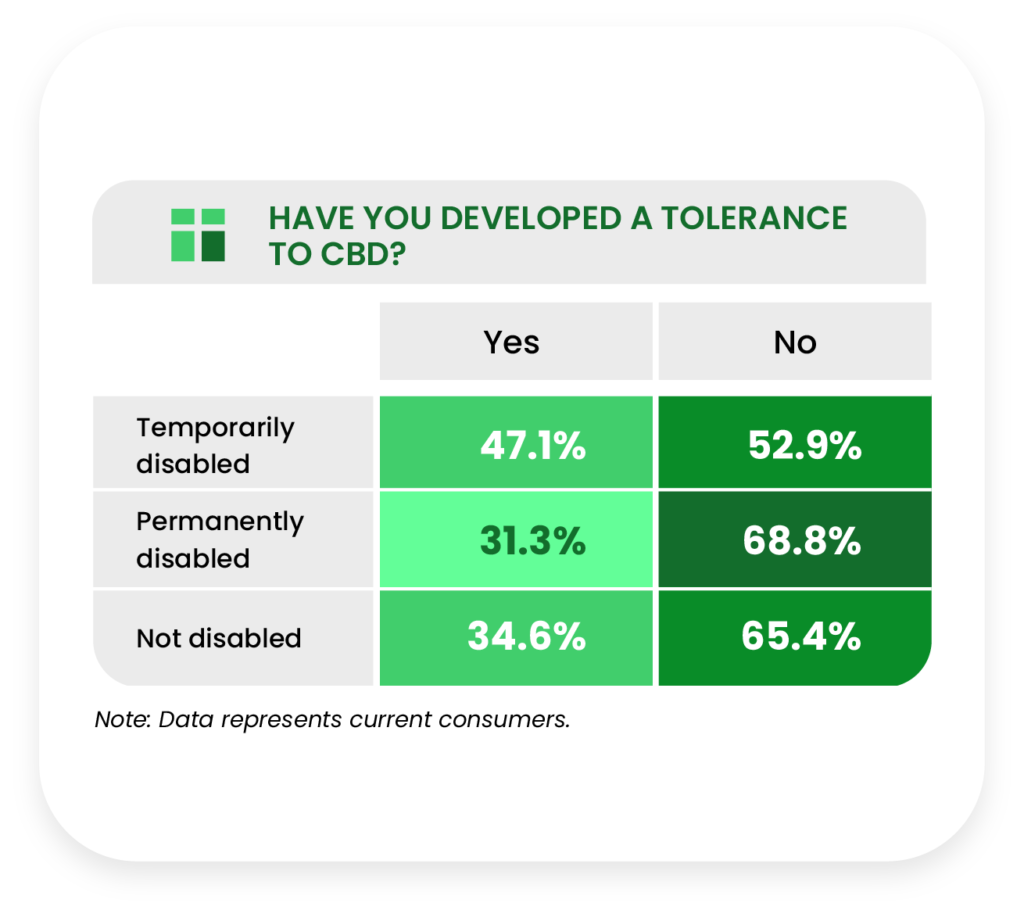
Temporarily disabled current consumers are much more likely to report a tolerance to CBD than permanently disabled and non-disabled respondents.
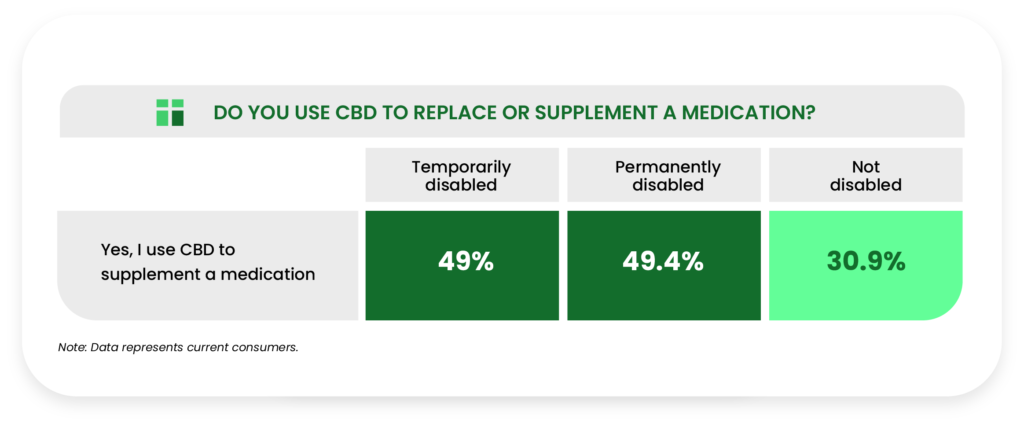
Temporarily (49%) and permanently disabled respondents (49.4%) were very similar in how many of them used CBD to supplement a medication, as opposed to 30.9% of non-disabled respondents.
Copyright
Copyright © 2021 by The CBD Insider. All rights reserved. Photocopying or reproducing this report in any form, including electronic or facsimile transmission, scanning or electronic storage, is a violation of federal copyright law and is strictly prohibited without the publisher’s express written permission.
While every effort has been made by The CBD Insider to ensure the accuracy of information in this report, it accepts no responsibility for errors or omissions. The report is provided as is, without warranty of any kind, either express or implied, respecting its contents, including but not limited to implied warranties for the report’s quality, performance, merchantability, or fitness for any particular purpose.
The CBD Insider shall not be liable to any person or entity with respect to any liability, loss, or damage caused or alleged to be caused directly or indirectly by this report.
Any person or entity may use the graphs included in this report under Attribution-ShareAlike 4.0 International (CC BY-SA 4.0). Under the following terms: You must give appropriate credit by providing a link to the licensed material (i.e., this report), and indicate if changes were made. You may do so in any reasonable manner, but not in any way that suggests the licensor endorses you or your use.
If you remix, transform, or build upon the material, you must distribute your contributions under the same license as the original. For more information about this license, please visit here.


